SAADAA × OPTIPHOENIX: A SIZE SELECTION REDESIGN DROVE A 20% CONVERSION RATE UPLIFT

Akasa Air operates with two primary fare tiers: Saver and Flexi. The Flexi fare includes meaningfully better benefits – complimentary meals, seat selection, significantly lower date change charges, and reduced cancellation fees. Yet the majority of users consistently chose Saver.
This wasn’t a pricing problem. Flexi fares were priced competitively given the value they offered. The issue was that most users weren’t making a fully informed choice. They were making a fast one.
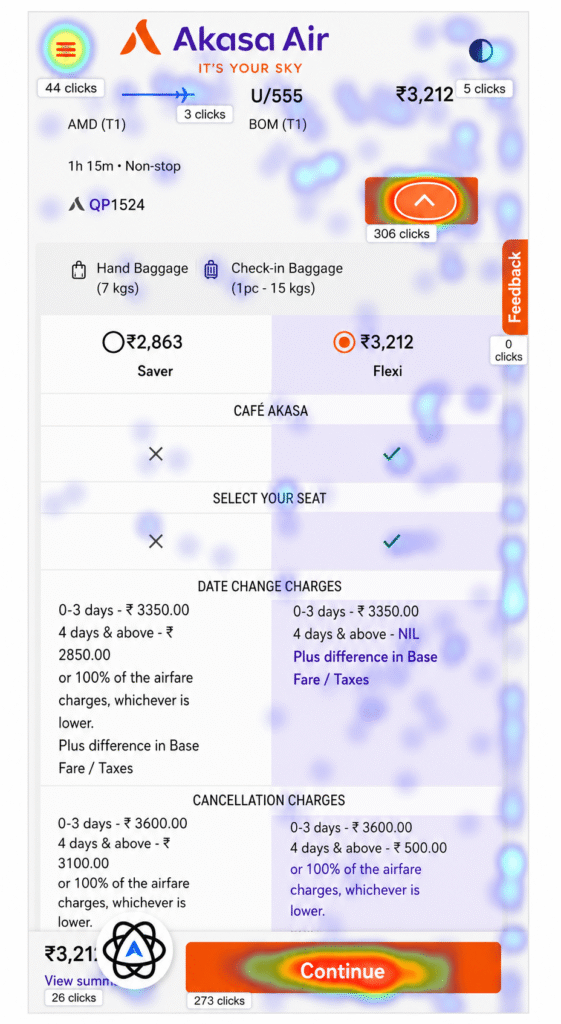
Heatmap data on the Flight Search Results Page showed low engagement with the Flexi option. GA data confirmed the pattern: Saver fares dominated both add-to-cart and purchase numbers, despite Flexi offering substantially more value for the incremental cost.
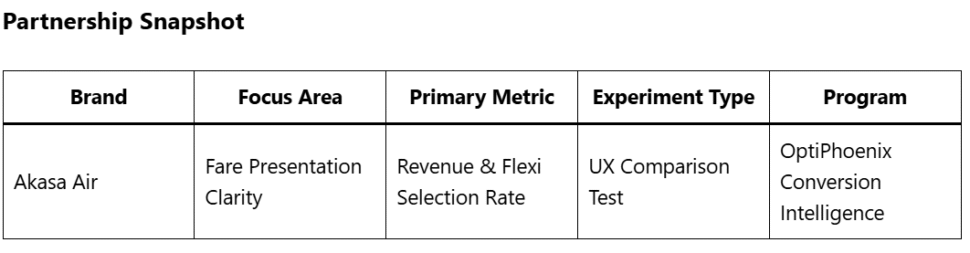
OptiPhoenix partnered with Akasa Air to test whether the gap in Flexi selection was a preference problem or a presentation problem.
The original fare display presented Saver and Flexi as two price points side by side, with benefits listed in a format that required users to read and compare across dense text.
When fare differences are communicated as text-heavy policy comparisons, most users default to the lower number. The cognitive cost of comparison tips the decision toward price rather than value.
The opportunity wasn’t to push Flexi – it was to make the comparison legible at a glance.
If the fare comparison is restructured into a clear table format that surfaces the tangible benefits of Flexi and a “Preferred” tag is added to signal social and editorial endorsement, more users will select Flexi, increasing both revenue per booking and overall ticket volume.
OptiPhoenix designed a focused A/B test on the fare selection interface:
Variant A (Control): Original fare display, with Saver and Flexi presented as adjacent price options with benefit text listed below.
Variant B (Test): Fare comparison redesigned as a structured table, with benefits mapped row by row against each fare type using clear visual indicators. A “Preferred” tag added above the Flexi column.
Changes to the test variant included direct benefit callouts for: Café Akasa (complimentary vs. paid), seat selection (complimentary vs. paid), date change charges, and cancellation fees.
All other booking flow elements remained unchanged.
Metrics Measured: Flexi selection rate, Flexi transactions, overall ticket bookings, revenue

The structured comparison produced a decisive shift in user behavior.
Flexi selection increased by 10%. Flexi transactions grew by 19%. Overall ticket bookings rose 6.3%. Revenue increased by 10%, translating to ₹43,400,049 in additional yearly revenue.
Users weren’t resistant to Flexi. They were underinformed about it.
A single change to how fare options were presented same prices, same benefits, different structure moved nearly one in five Flexi transactions that hadn’t been happening before.
Comparison design is a conversion variable. When users can evaluate two options side by side in a structured format, they make better decisions for themselves and often choose the option with higher value.
Default choices follow the path of least cognitive resistance. A lower price wins by default when comparing requires effort. Remove the effort, and value wins more often.
Social proof accelerates decisions. The “Preferred” tag didn’t manufacture a preference. It confirmed one that data already supported, giving users permission to act on it.
Higher-value choices can increase total volume. The 6.3% lift in overall bookings suggests that fare clarity reduced abandonment buyers who might have stalled on the comparison page completed their booking instead.
The Akasa Air experiment illustrates a principle that holds across industries: when a better option exists, the job of design is to make that option visible, not persuasive.
Akasa Air’s Flexi fare was already worth choosing. The experiment didn’t change the product. It changed the lens through which users evaluated it. A table replaced a wall of text. A “Preferred” label reduced hesitation. And the result was a booking pattern that more accurately reflected what customers actually wanted once they could see clearly what they were getting.