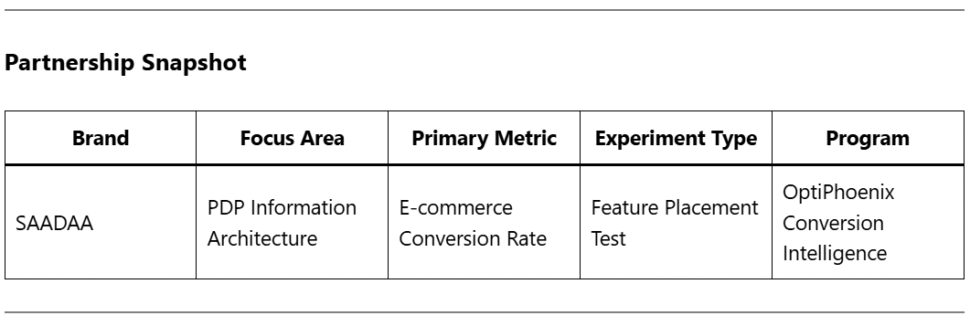
SAADAA × OPTIPHOENIX: A SIZE SELECTION REDESIGN DROVE A 20% CONVERSION RATE UPLIFT

For most D2C fashion brands, the product detail page is built around the hero image. Everything else follows – features, fabric details, brand promises – buried lower on the page, where many shoppers never reach.
SAADAA’s PDP followed this familiar structure. The brand’s key product highlights were positioned well below the fold, surfaced only to users willing to scroll through multiple sections first.
The question was straightforward: were customers missing information that would have moved them to buy?
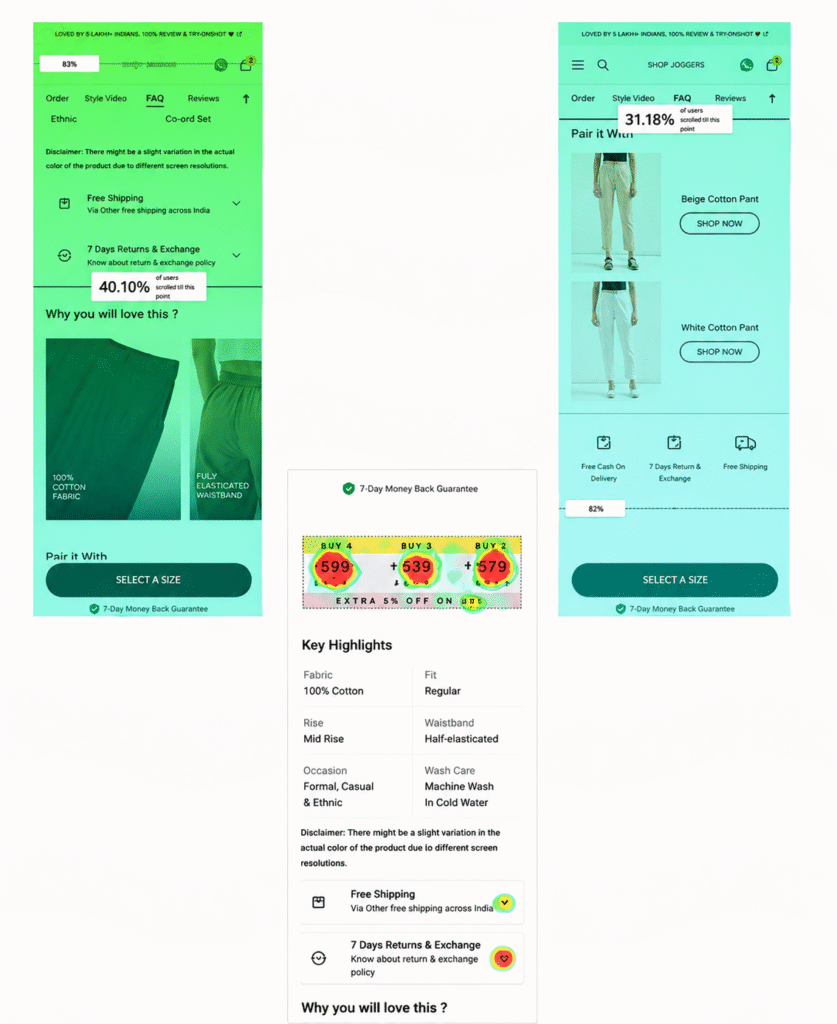
Heatmap and scrollmap data suggested yes. 50% of users dropped off before reaching the Key Highlights section. 70% never saw the brand’s value propositions in the lower folds at all.
OptiPhoenix partnered with SAADAA to test whether repositioning this information higher on the page would change purchase behavior.
The data pointed to a structural problem!
The product features customers needed to make a confident decision – fabric composition, fit, occasion, wash care – existed on the page. They were simply placed where most users never arrived.
Heatmaps confirmed that engagement dropped sharply after the image gallery. Users were making purchase decisions, or abandoning, before the page had a chance to make its case.
This reframed the experiment: the copy didn’t need to change. The sequence did.
If product features are moved higher in the image carousel – visible earlier in the browsing experience – users who engage with that information will convert at a higher rate, lifting overall e-commerce conversion.
OptiPhoenix designed a controlled A/B test with a focused structural change:
Variant A (Control): Original PDP layout, with product features positioned in the lower page sections.
Variant B (Test): Key Highlights embedded directly in the third image of the carousel, surfacing feature information earlier without requiring scroll depth.
All other variables – pricing, copy, offer stack, imagery – remained unchanged.
The goal: isolate the conversion impact of feature visibility alone.
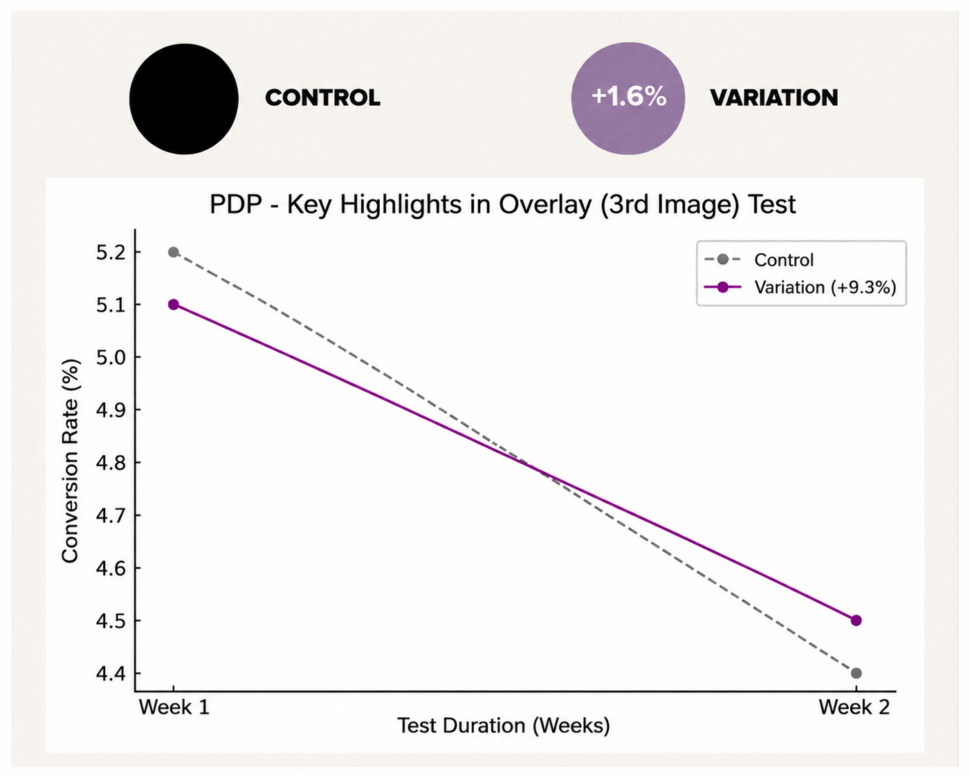
Duration: 2 weeks Metrics Measured: E-commerce conversion rate, funnel progression, engagement with key highlights
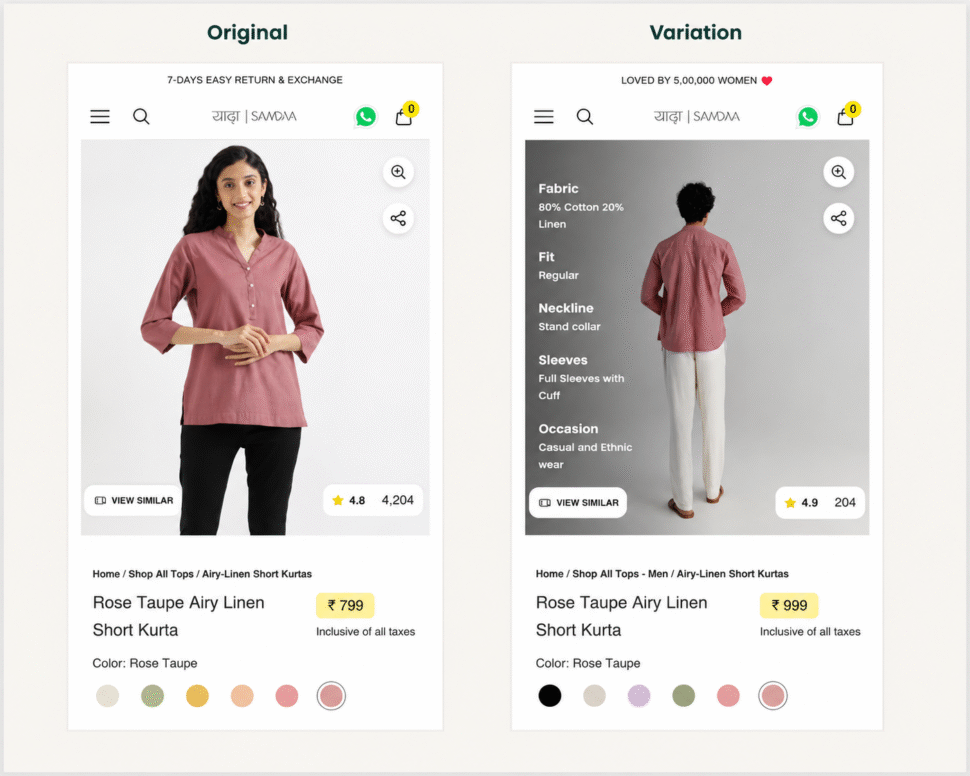
The variation outperformed the control across every measured metric.
Among users who scrolled to and viewed the Key Highlights in the third image, conversion rate improved by 3.5%. Overall e-commerce conversion rate saw a 1.6% uplift across all traffic. Funnel progression increased, with more users moving from the PDP toward checkout.
The information was never the problem. Placement was.
This experiment changed how SAADAA thought about page architecture not as a design preference, but as a conversion variable.
Scroll depth is a decision gate. If customers are leaving before they see your strongest product arguments, those arguments are not doing any work.
Structure shapes behavior. Moving the same information to a higher position produced measurably different outcomes. The content didn’t change. The architecture did.
Heatmaps answer the “where” before the “why.” The data showed exactly where attention ended. The experiment confirmed what moving that threshold meant for revenue.
Early information reduces friction. When buyers can evaluate a product without hunting for details, the path to purchase gets shorter.
This experiment confirmed something OptiPhoenix consistently observes across D2C brands: customers don’t abandon because they’ve decided against a product. They often abandon because they haven’t seen enough of it.
For SAADAA, moving the Key Highlights earlier didn’t change what the brand said. It changed when the customer heard it. And that timing, measured across thousands of sessions, translated directly into more purchases.