SAADAA × OPTIPHOENIX: A SIZE SELECTION REDESIGN DROVE A 20% CONVERSION RATE UPLIFT

Flooret’s product pages offer multiple flooring models – Base, Signature, Craftsman, Herringbone – each with different plank sizes, mil thicknesses, and bevel types. For a buyer deciding which model fits their room, the ability to compare those differences directly is a meaningful part of the decision.
A comparison tool existed on the page. Scrollmap data showed that only 12% of users ever reached it. Yet among those who did engage with the Compare section, the conversion rate was 8.65% – more than double the page’s average PDP conversion rate of approximately 4%.
The feature was doing significant work for the small share of users who found it. The question was whether moving the entry point earlier would extend that benefit to more of the page’s traffic.
OptiPhoenix partnered with Flooret to test a targeted intervention: add a Compare Models CTA directly above the model selection section, where users were already focused.
Users don’t fail to compare because they aren’t interested in comparing. They fail to compare because the tool requires scrolling through the majority of the page to access.
For a high-consideration product where model differences are real and meaningful – 6″x48″ versus 9″x72″ planks, 20 mil versus 40 mil wear layers – decision confidence depends on being able to evaluate those differences. Users who got to the comparison section converted at twice the baseline rate. Getting them there earlier was the lever.
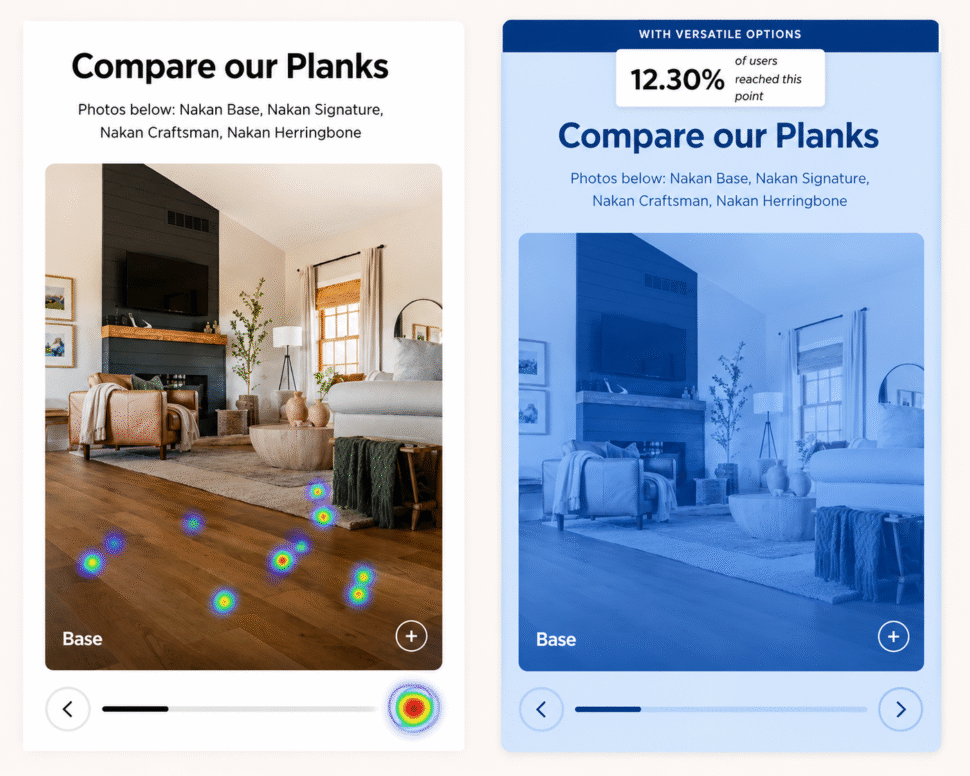
If a Compare Models CTA is placed directly above the Model section – where users are actively evaluating their options – more users will engage with the comparison feature, improving decision confidence and increasing conversion across both sample and box purchases.
OptiPhoenix designed a focused A/B test with a single interaction change:
Variant A (Control): Original PDP layout, with the Compare Planks tool accessible only in the lower page fold.
Variant B (Test): A “Compare Models” CTA link added directly above the Model selection section. When clicked, it surfaces a visual comparison overlay showing all four models side by side with full plank dimensions, wear layer, and bevel specifications.
All other page elements remained unchanged.
Metrics Measured: Add-to-cart rate, overall conversion rate, sample purchases, box purchases
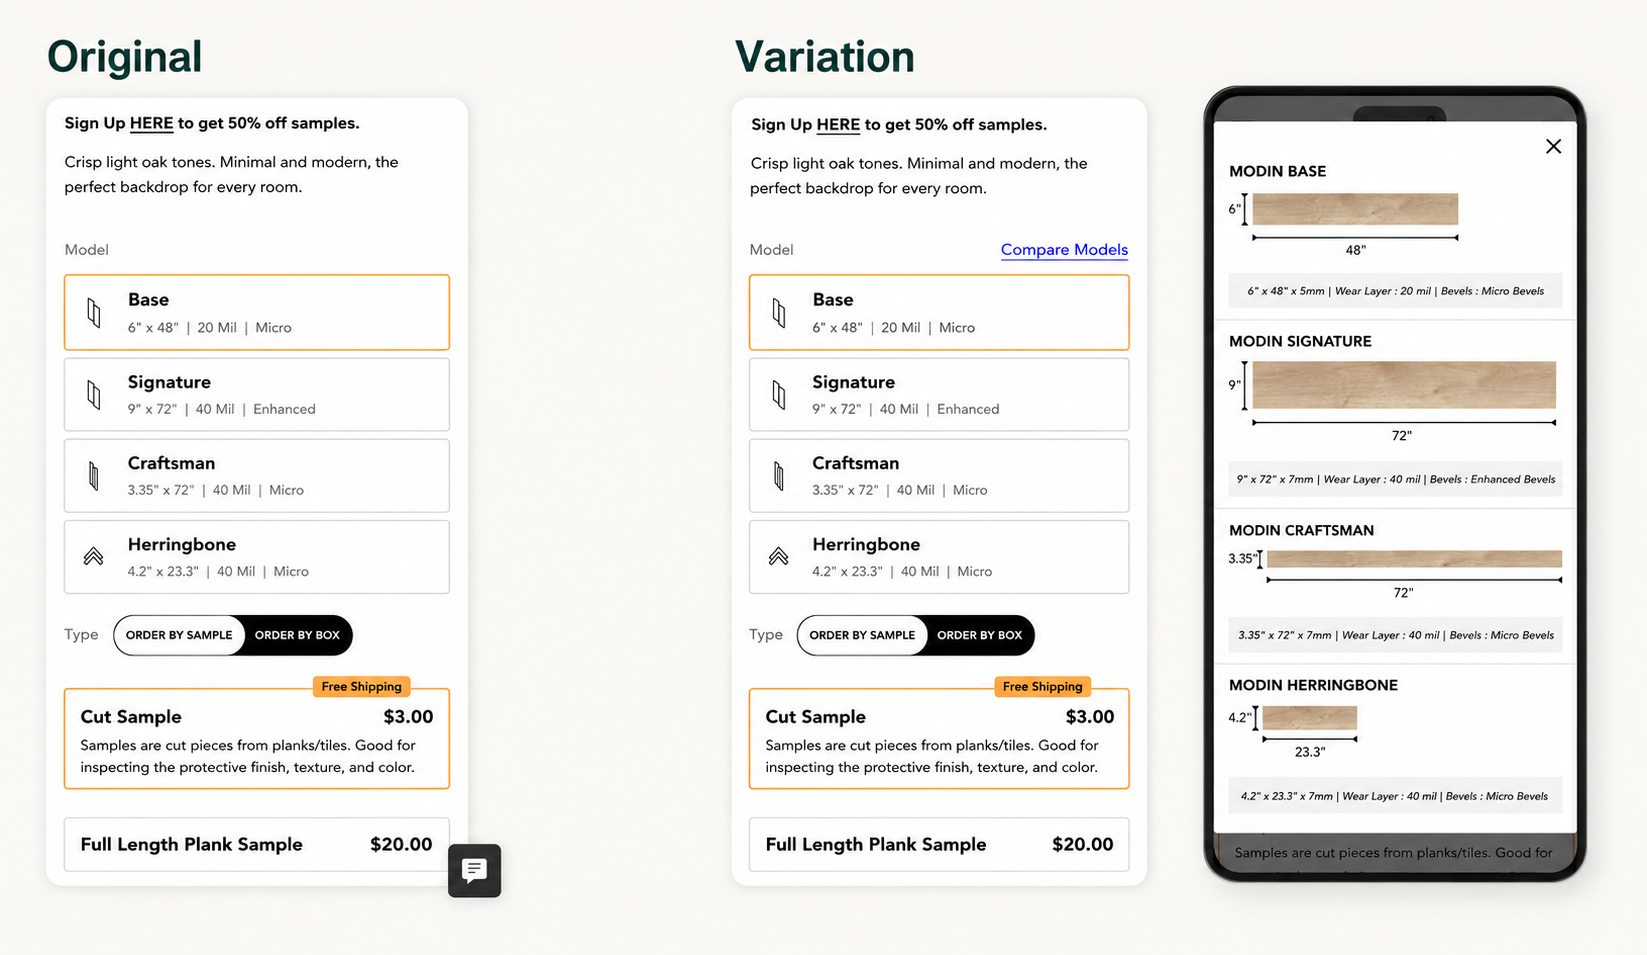
The earlier comparison entry point produced consistent improvement across the funnel.
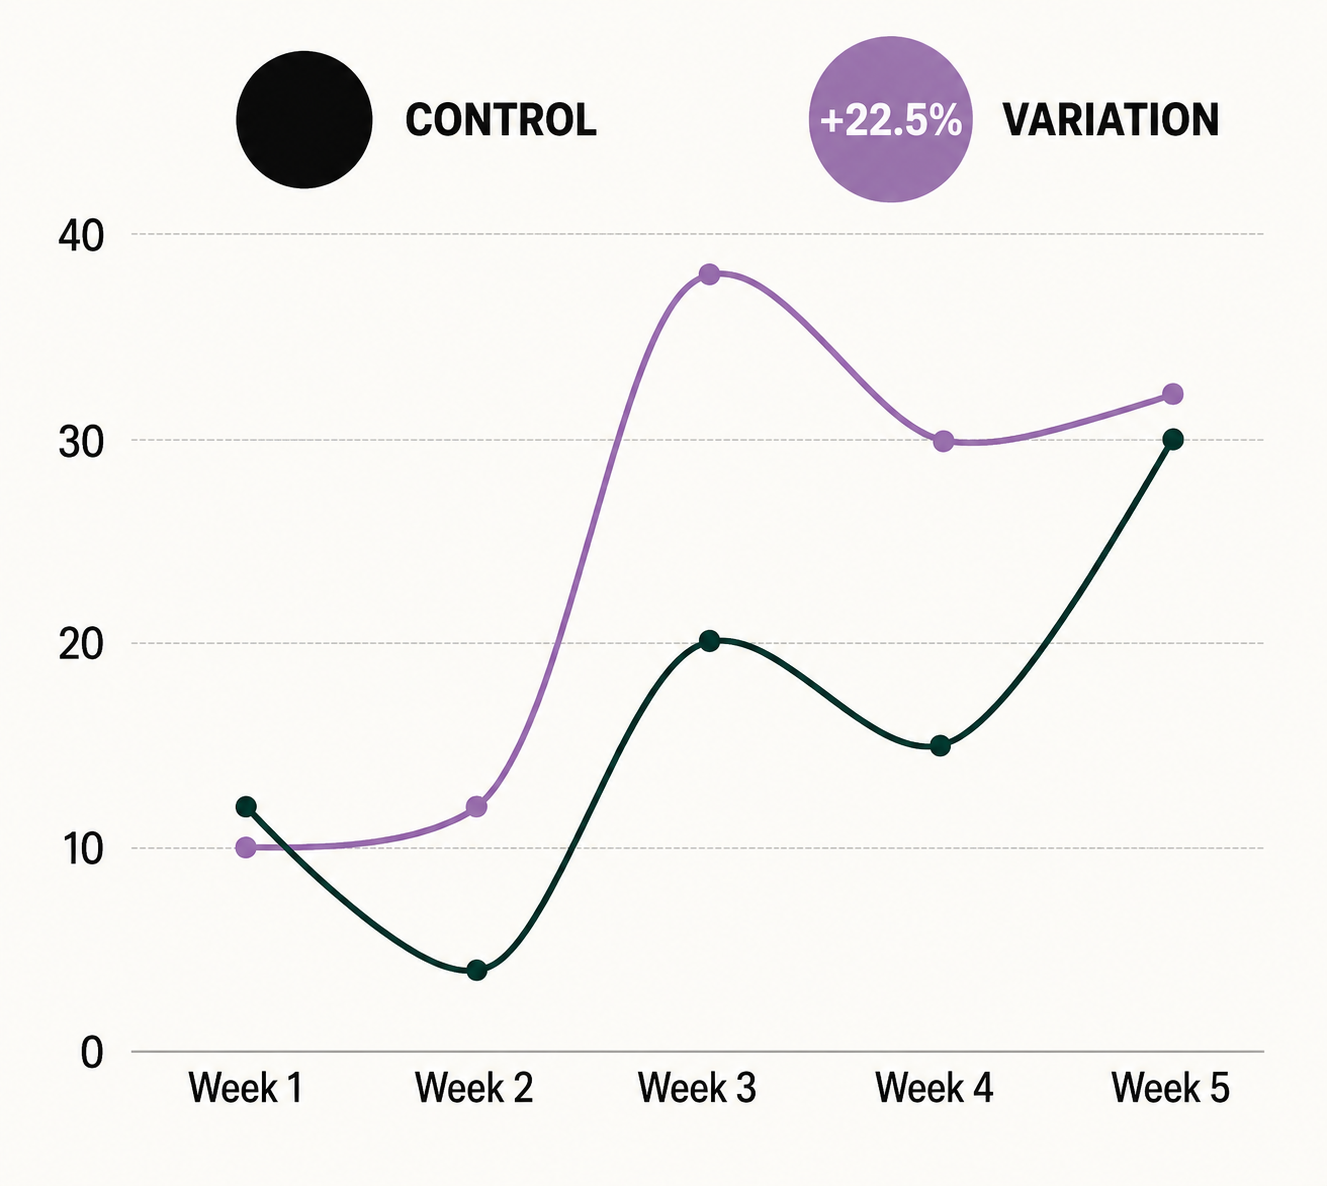
Add-to-cart rate increased by 11.6%. Overall conversion rate improved by 22.5%. Sample purchases grew by 31% and box purchases by 28%.
Users who could compare models at the moment they were choosing a model made better and faster decisions.
Decision tools work best when placed at the decision moment. The comparison feature had a strong effect on conversion when users found it. Moving it closer to the point in the page where the relevant decision was being made extended that effect to a much larger share of traffic.
High-performing buried features are a common conversion opportunity. When analytics show a feature with a strong conversion correlation but low reach, the question is rarely whether to remove it – it’s whether to move it.
Comparison reduces hesitation across all purchase types. The lift in both sample and box purchases suggests that clearer model understanding increased confidence regardless of which path to purchase users chose.

The comparison tool that drove double the conversion rate was already on the page. This experiment didn’t build anything new. It asked one question – what happens when users can access this feature where they actually need it – and the answer was a 22.5% conversion rate increase and meaningful lifts in purchases across both product categories.