SAADAA × OPTIPHOENIX: A SIZE SELECTION REDESIGN DROVE A 20% CONVERSION RATE UPLIFT
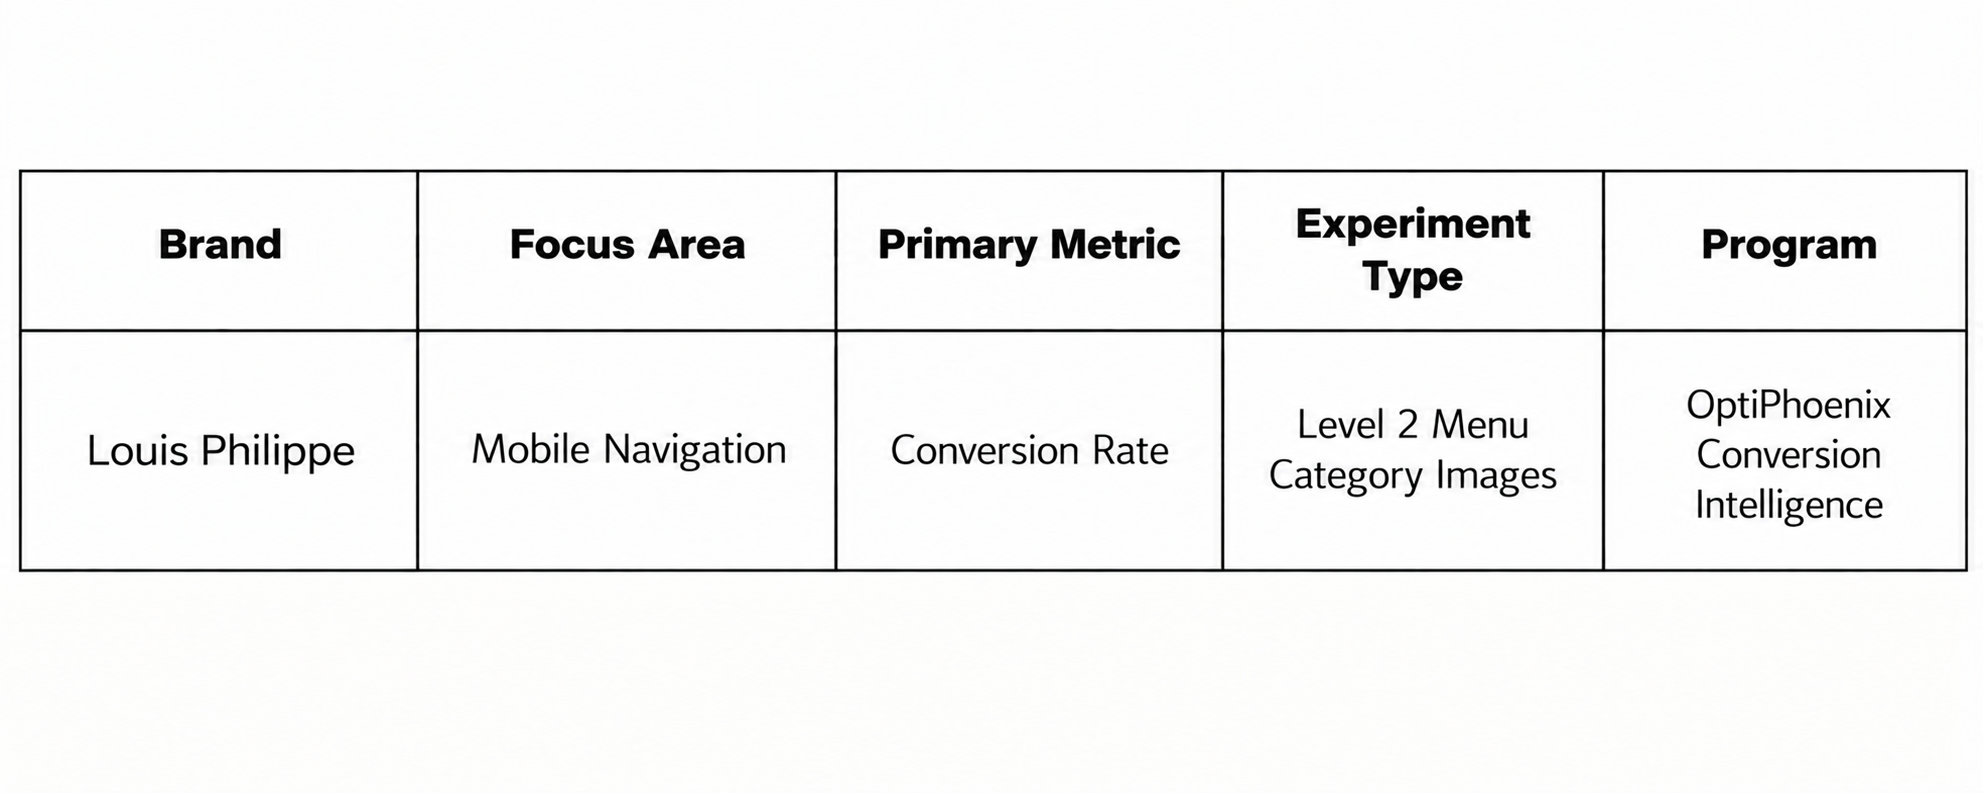
Louis Philippe is one of the brands available through the ABFRL SuperApp. The SuperApp is a unified fashion shopping platform that brings together brands including The Collective, Louis Philippe, Van Heusen, Allen Solly, Peter England, Pantaloons, American Eagle, and Forever 21. On Louis Philippe’s mobile site, the Level 2 navigation menu showed categories as a text-only list. Shoppers had to scan several options before they found the one they wanted. Without visual cues, this took more effort and slowed category discovery.

OptiPhoenix partnered with Louis Philippe to test whether adding images to this menu would make categories easier to find and improve conversion.
A text label tells a shopper what a category is called. But it does not show what is inside it. So shoppers had to read each label and decide where to tap.
On a small mobile screen, that reading adds up. Images work differently, because a shopper can recognize them at a glance. The gap sat between a shopper looking for a category and a menu that asked them to read instead of recognize.
OptiPhoenix proposed adding a representative image next to each Level 2 category name. The team also planned to improve the visual hierarchy of the menu. Together, these changes were expected to speed up category recognition, help shoppers reach relevant products faster, and drive a higher conversion rate.

OptiPhoenix ran a controlled A/B test on Louis Philippe’s mobile navigation.
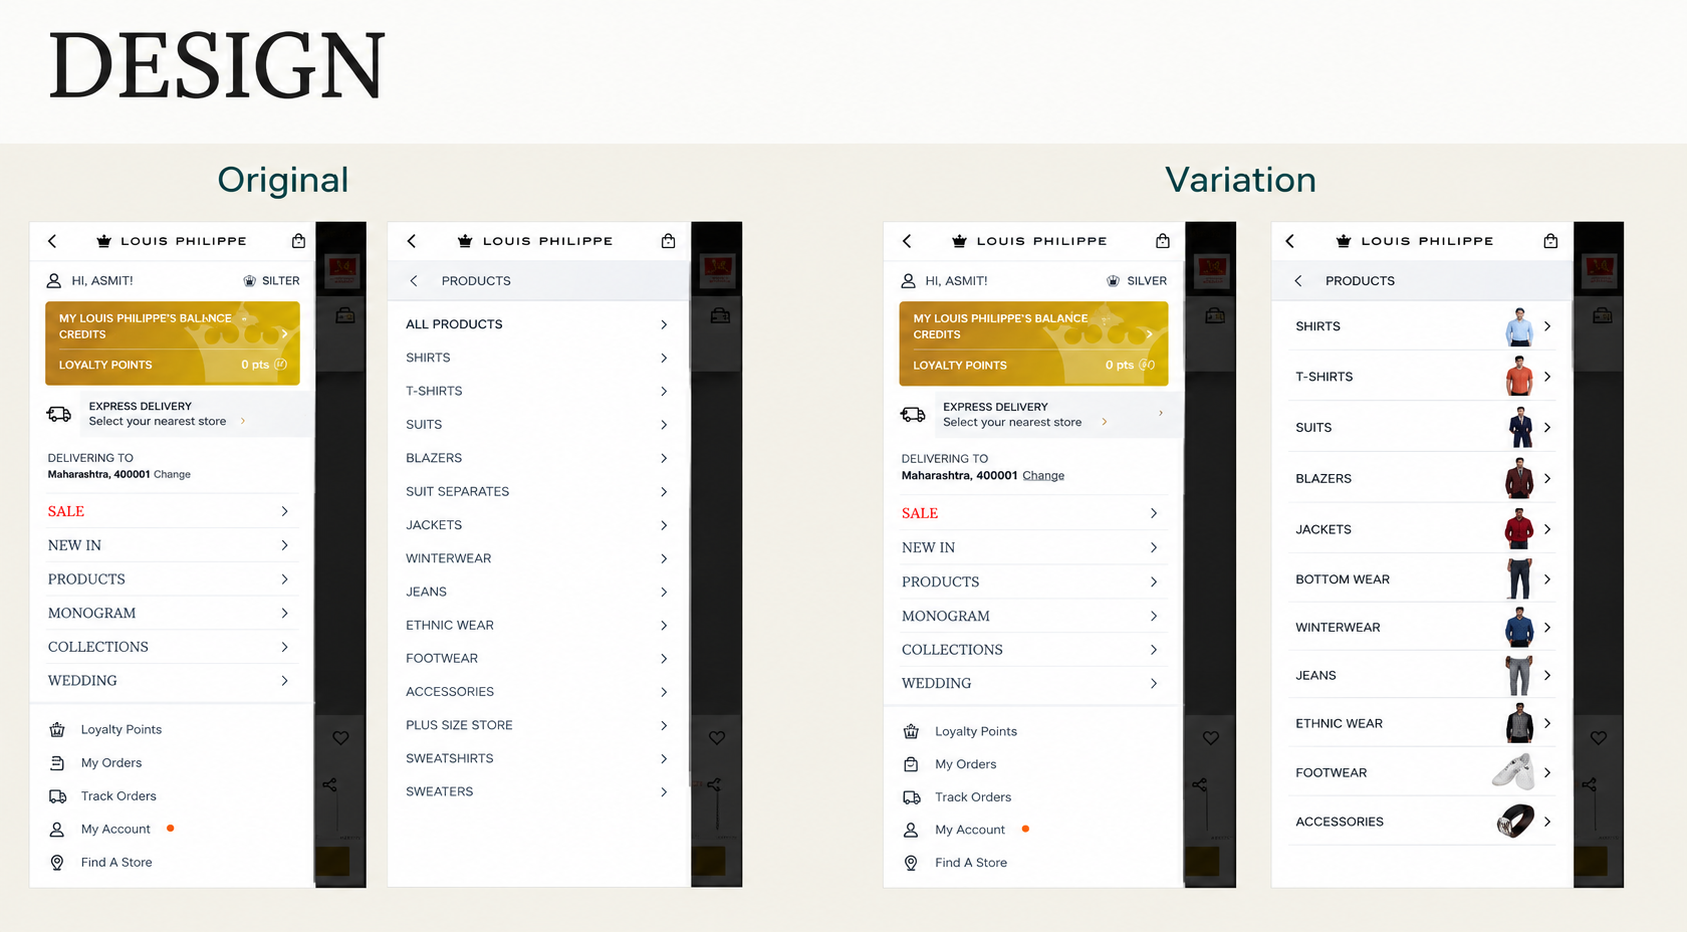
Variant A (Control): The original Level 2 menu, which displayed category names as a text-only list.
Variant B (Test): A representative image added for each Level 2 category, along with an improved visual hierarchy within the menu.
Metrics measured: Conversion Rate, Revenue, and Order rate.
Giving each category a visual identity moved more shoppers toward a purchase.
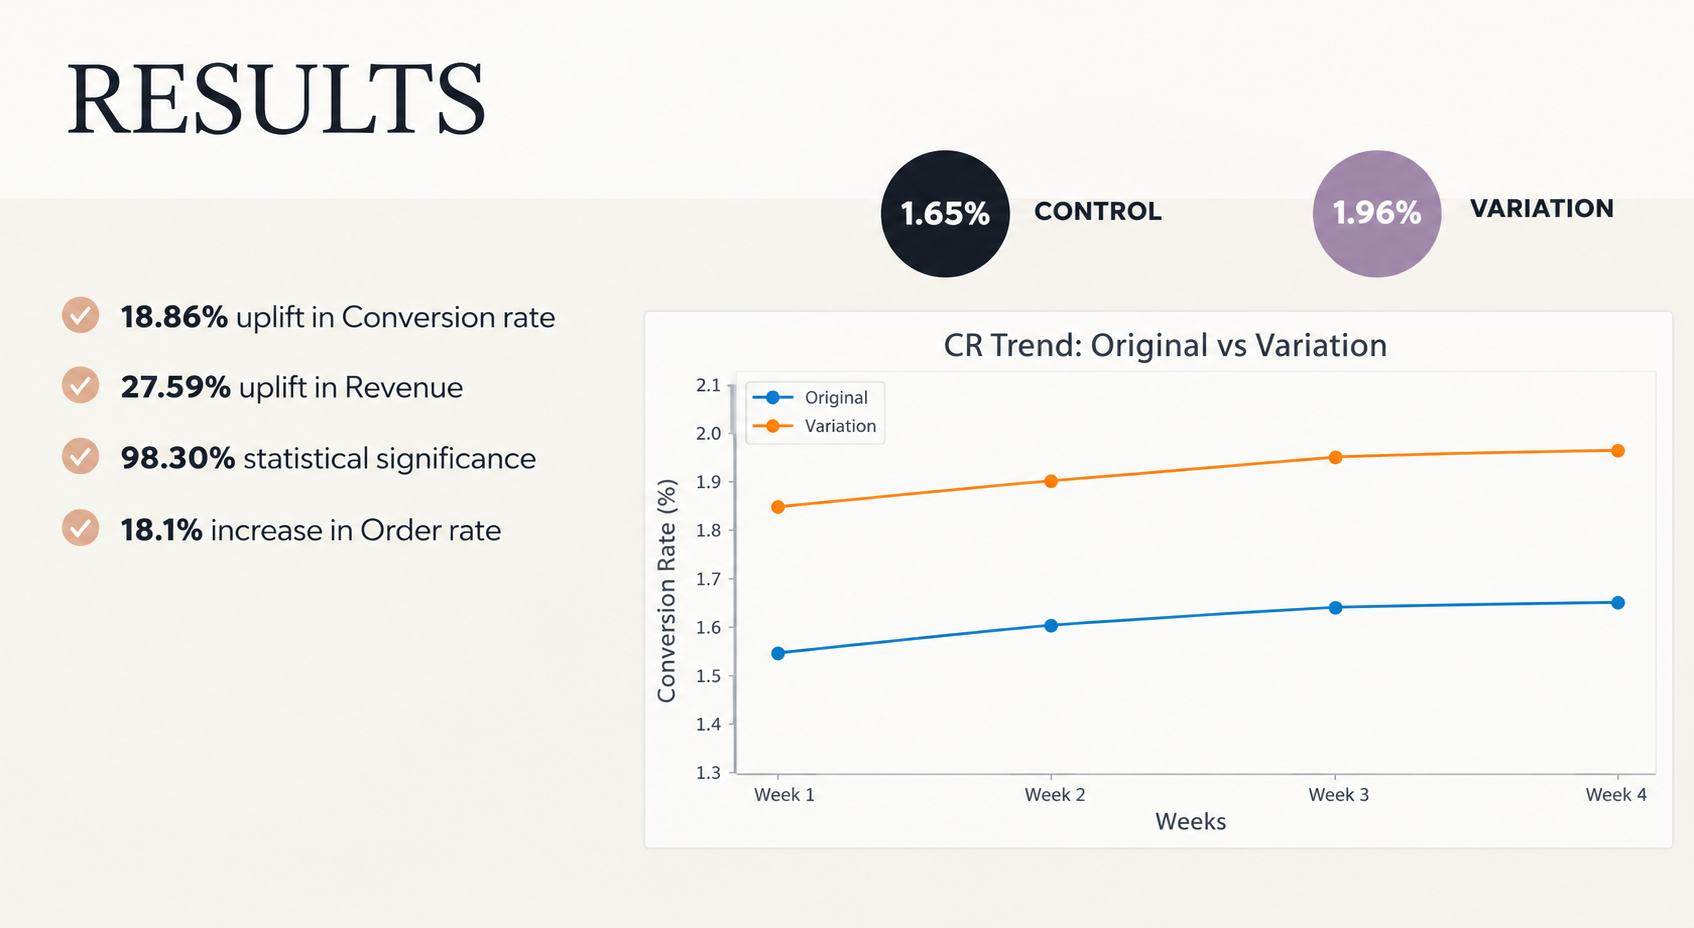
Conversion Rate rose from 1.65% to 1.96%, an 18.86% increase. The result reached 98.30% statistical significance. Revenue rose 27.59% over the same test. Order rate also rose 18.1%.

Recognition is faster than reading. Shoppers no longer had to interpret a list of labels. Instead, they could spot the right category by its image. That reduced the effort of finding products.
A visual change can move more than one metric. Conversion Rate, Revenue, and Order rate all rose together. This suggests the menu change helped shoppers get to products they wanted to buy, not just browse more.
The result is well supported. At 98.30% statistical significance, the lift is unlikely to be due to chance. As a result, image-led navigation is worth testing on other category menus.
Louis Philippe shoppers were not missing categories because the categories were absent. They were slowed down by a menu that asked them to read every option. By adding images to the Level 2 menu, OptiPhoenix made each category easier to spot. So shoppers reached the products they wanted faster.