SAADAA × OPTIPHOENIX: A SIZE SELECTION REDESIGN DROVE A 20% CONVERSION RATE UPLIFT
Peter England sells through the ABFRL SuperApp. The platform unites brands including The Collective, Louis Philippe, Van Heusen, Allen Solly, Pantaloons, American Eagle, and Forever 21.
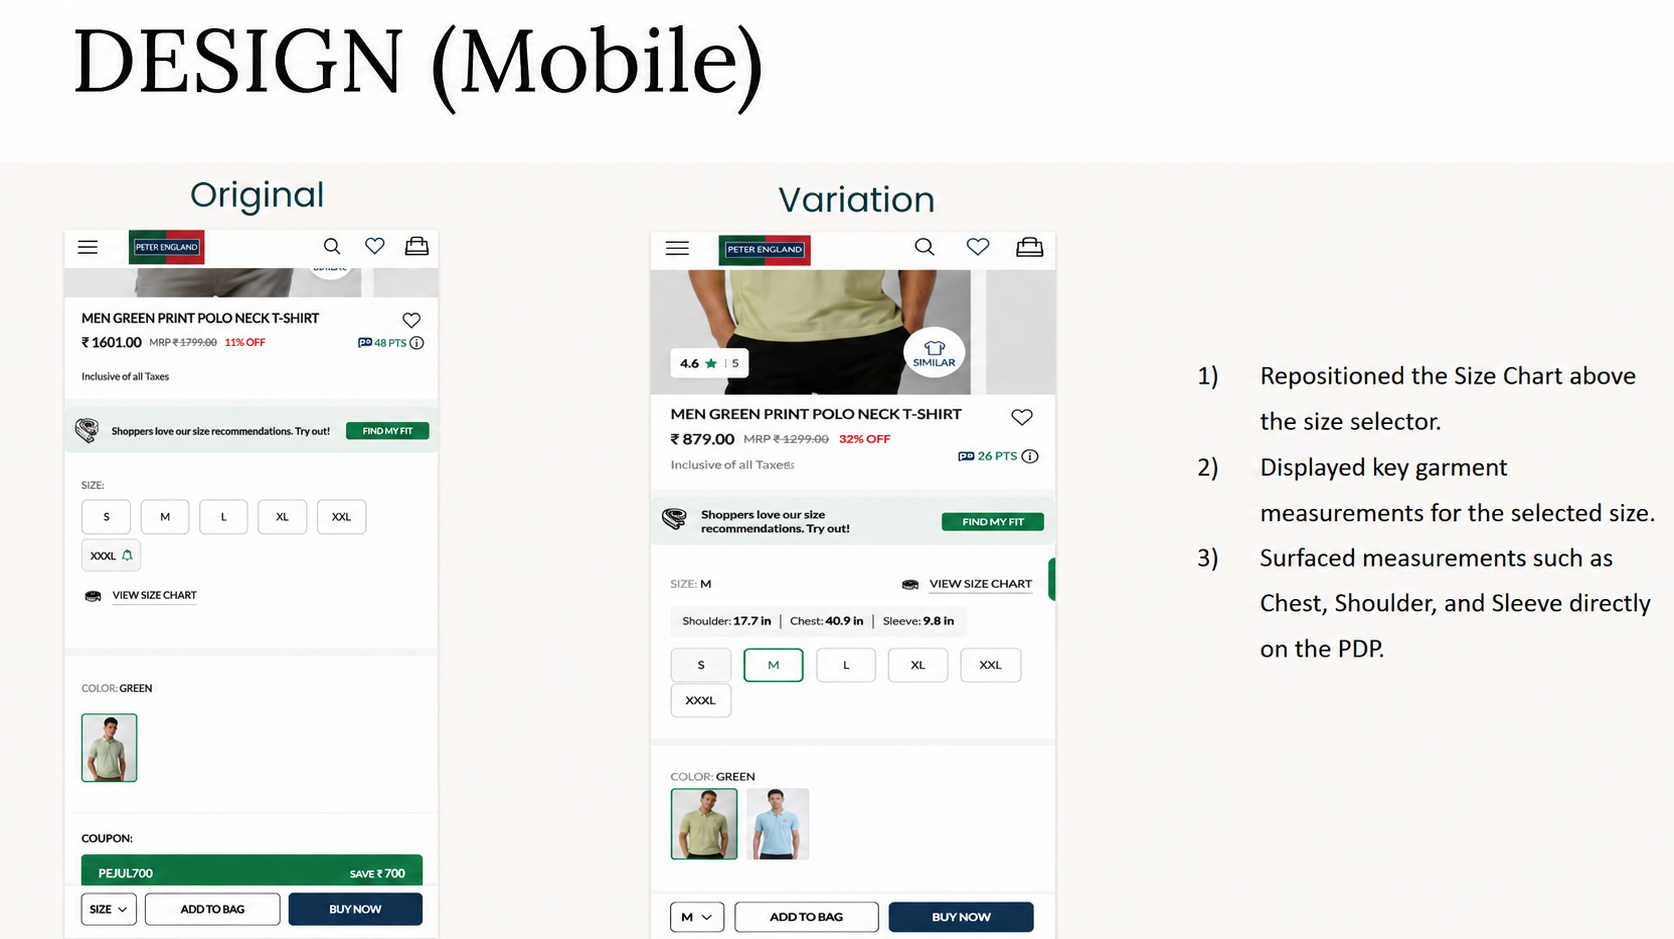
On the Peter England Product Detail Page, the layout showed only size options. The Size Chart sat below the size selector. Users had to open it separately to check garment measurements. This extra step added friction at a moment that directly affects purchase confidence.

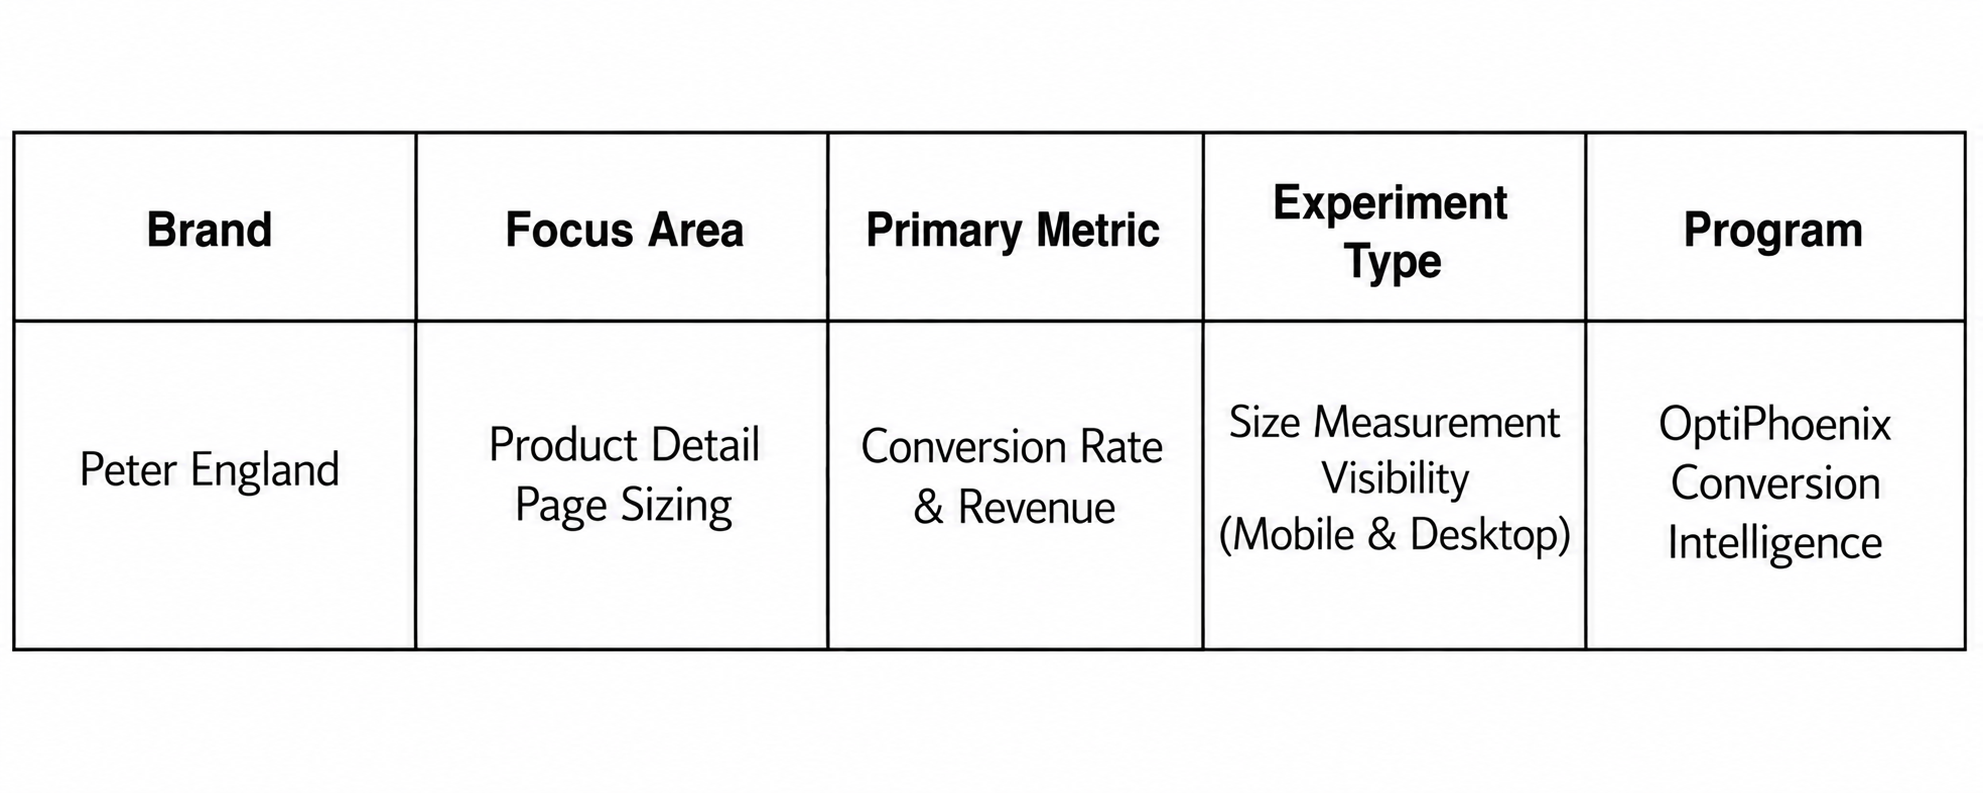
So OptiPhoenix partnered with Peter England to test a fix. The team wanted to know if surfacing size measurements directly on the page would reduce that friction. The test ran across Mobile and Desktop
Knowing which size to pick is not the same as knowing whether that size will fit. A user could see the available sizes, but had to take an extra step, opening a separate Size Chart, to check the actual measurements behind them.
That extra step matters most at the exact point a purchase decision is being made. The gap sat between a user ready to choose a size and a page that made them go looking for the information that would confirm the choice was right.
OptiPhoenix proposed that displaying key size measurements for the selected size directly on the page, and moving the Size Chart above the size selector, would help users verify sizing more easily and purchase with greater confidence. This was expected to drive a higher conversion rate.

OptiPhoenix ran a controlled A/B test on Peter England’s PDP, across both Mobile and Desktop.
Variant A (Control): The original layout, with only size options displayed and the Size Chart positioned below the size selector.
Variant B (Test): Key size measurements for the selected size surfaced directly on the page, and the Size Chart repositioned above the size selector.
Metrics measured: Conversion Rate, Revenue, and order behavior tied to size interactions.
Surfacing sizing information directly on the page produced two different outcomes depending on the platform.
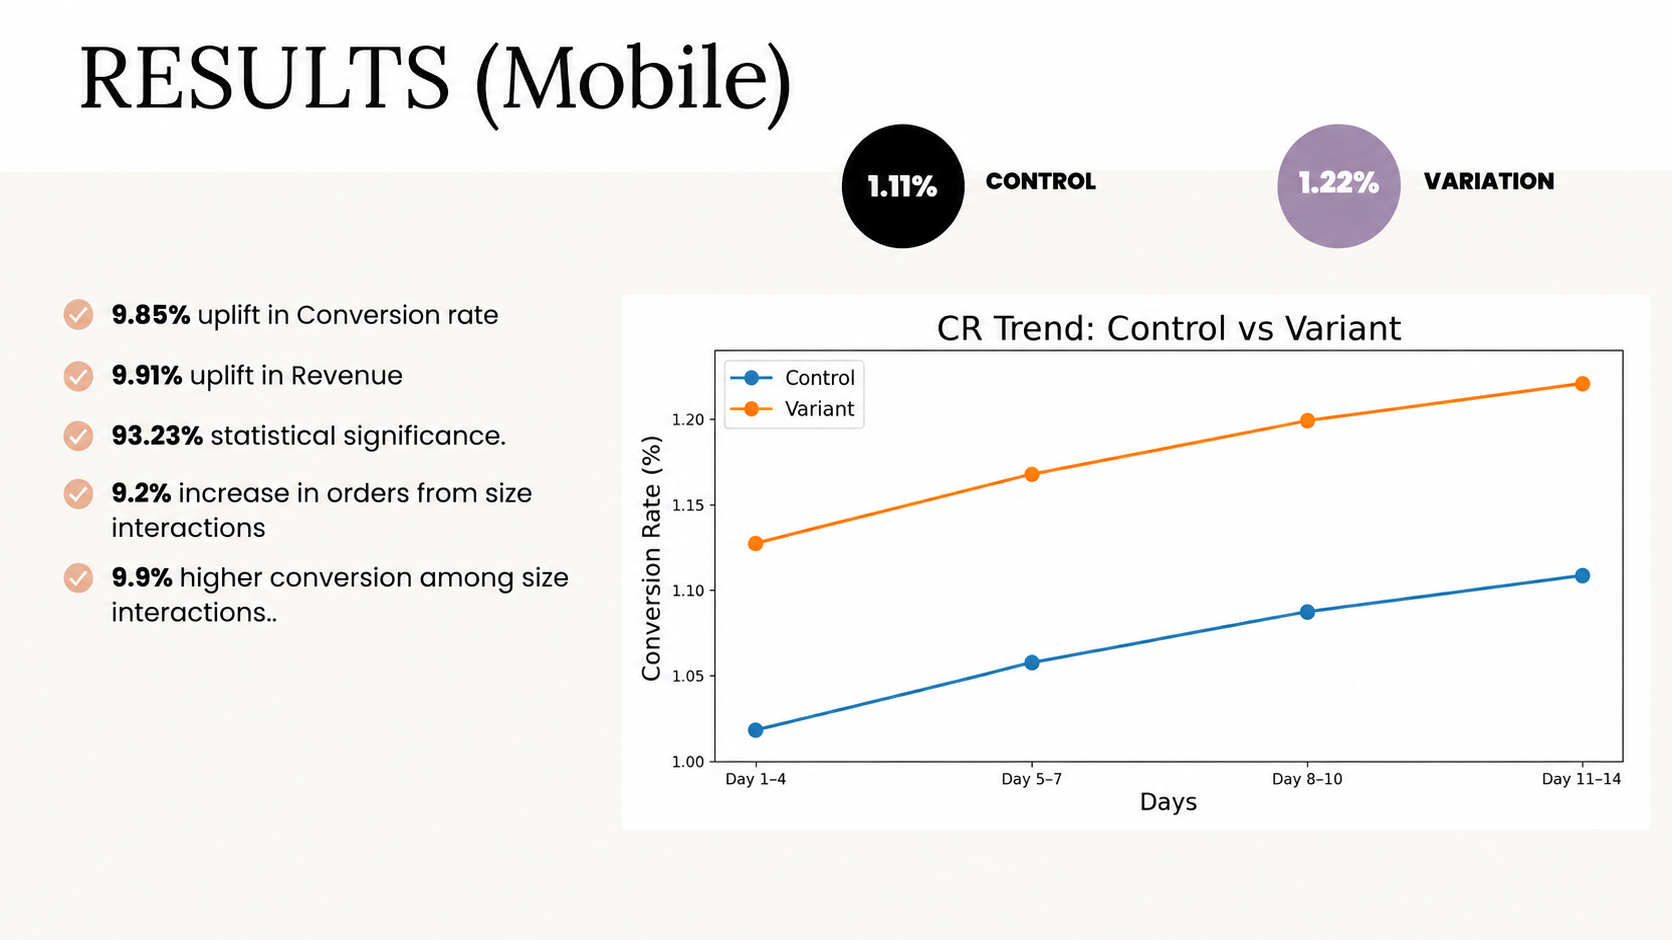
On Mobile, Conversion Rate rose from 1.11% to 1.22%, a 9.85% increase, reaching 93.23% statistical significance. Revenue rose 9.91% over the same test. Orders tied to size interactions rose 9.2%, and users who interacted with size information converted at a 9.9% higher rate.
On Desktop, Conversion Rate declined from 2.51% to 2.48%, a 0.96% decrease, at only 45.79% statistical significance. Revenue still rose 4.60% over the same test, with a 3.9% increase in revenue per order.
The same change does not always produce the same result across platforms. Mobile users, likely working with less screen space and less patience for extra steps, responded strongly to having size information surfaced directly. Desktop users, with more room to view a separate Size Chart comfortably, saw a smaller and statistically unreliable shift in Conversion Rate.
Revenue and Conversion Rate can move in different directions. Desktop Conversion Rate declined slightly while revenue rose, driven by a higher revenue per order. This suggests the change may have influenced what users bought rather than whether they bought, at least on Desktop.
Low statistical significance means a result should not be treated as settled. At 45.79% significance, the Desktop Conversion Rate decline is not a confirmed effect. It should be read as inconclusive rather than as evidence the change hurt Desktop performance.
Peter England’s Mobile shoppers were not unsure of what sizes were available, they were unsure whether those sizes would fit, and finding out cost them an extra step. Surfacing size measurements directly closed that gap and drove a clear Mobile conversion lift. On Desktop, the same change moved revenue without a confirmed shift in Conversion Rate, a reminder that not every win looks the same across platforms.