SLEEPYCAT × OPTIPHOENIX: TRUST REASSURANCE NEAR ADD TO CART DROVE A 137.95% CONVERSION RATE UPLIFT
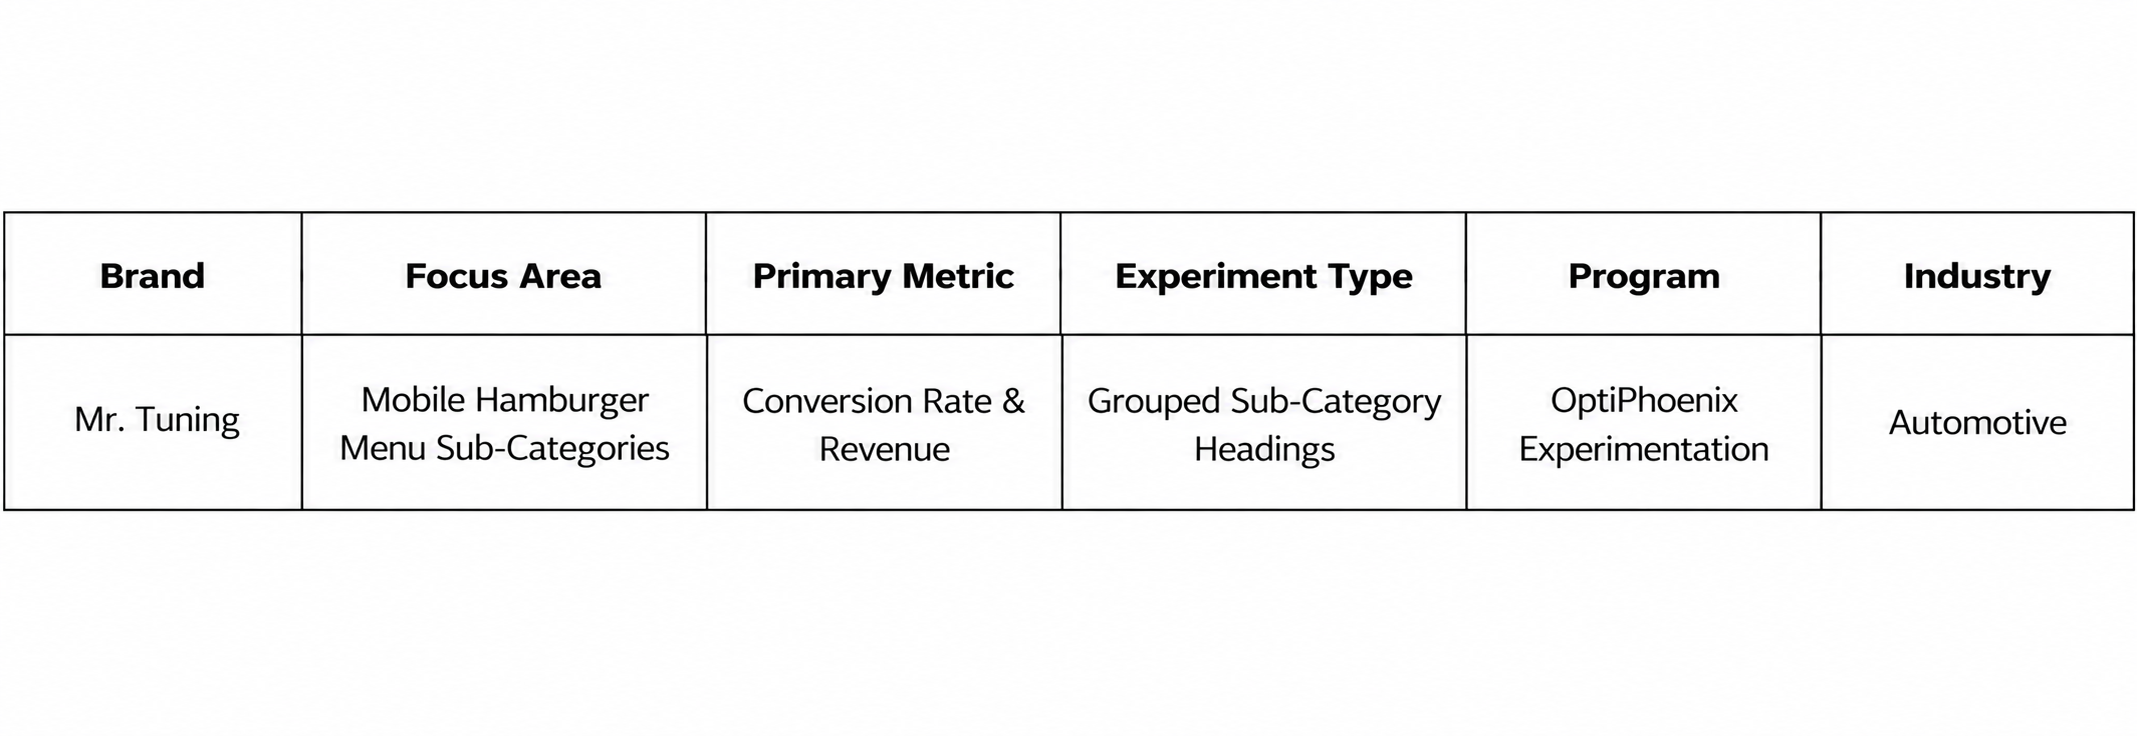
Mr. Tuning’s mobile store organizes its products in a hamburger menu. Under the Universal section, the sub-categories appeared as one flat, unsorted list. Items such as exhaust accessories, boost controllers, lighting, brakes, and fuel systems ran together, one after another, with no structure to separate them. On a small screen, a long list like that is slow to scan.

OptiPhoenix partnered with Mr. Tuning to test whether grouping related items under clear headings would make the menu easier to use and improve conversion.
A flat list asks the shopper to read every line. Someone looking for a turbo part has to pass over lighting, brakes, and electronics to find it.
Related products also sat far apart. A boost controller and a turbo belong to the same job, but the list did not show that link. So the gap sat between shoppers who knew the kind of part they needed and a menu that did not group parts by purpose.
OptiPhoenix proposed adding categorized section headings inside the sub-category menus, such as “Motor & Överladdning” and “Kylsystem”. Related items would sit in distinct logical sections instead of one flat list. This was expected to improve product hierarchy and menu readability, reduce navigation friction, help users find specific sub-categories faster and drive more traffic to deeper category pages.

OptiPhoenix ran a controlled A/B test on the Mr. Tuning mobile hamburger menu for all users.
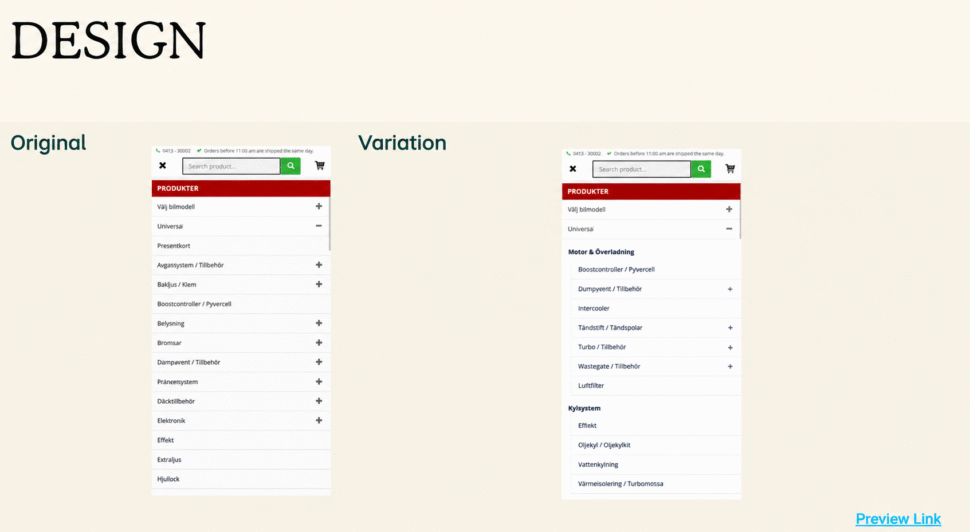
Variant A (Control): The original menu, with sub-categories shown as a flat list.
Variant B (Test): The same sub-categories grouped under bold section headings, with related items indented beneath each heading. For example, boost controllers, intercoolers, turbo parts, and air filters sat under “Motor & Överladdning”. The electric fan, oil cooler, and water cooling items sat under “Kylsystem”.
Metrics measured: Conversion Rate, orders, Revenue, Average Order Value (AOV), Revenue per Visitor, menu clicks at each level, and scroll rate.
A menu that grouped products by purpose moved more shoppers to a purchase.
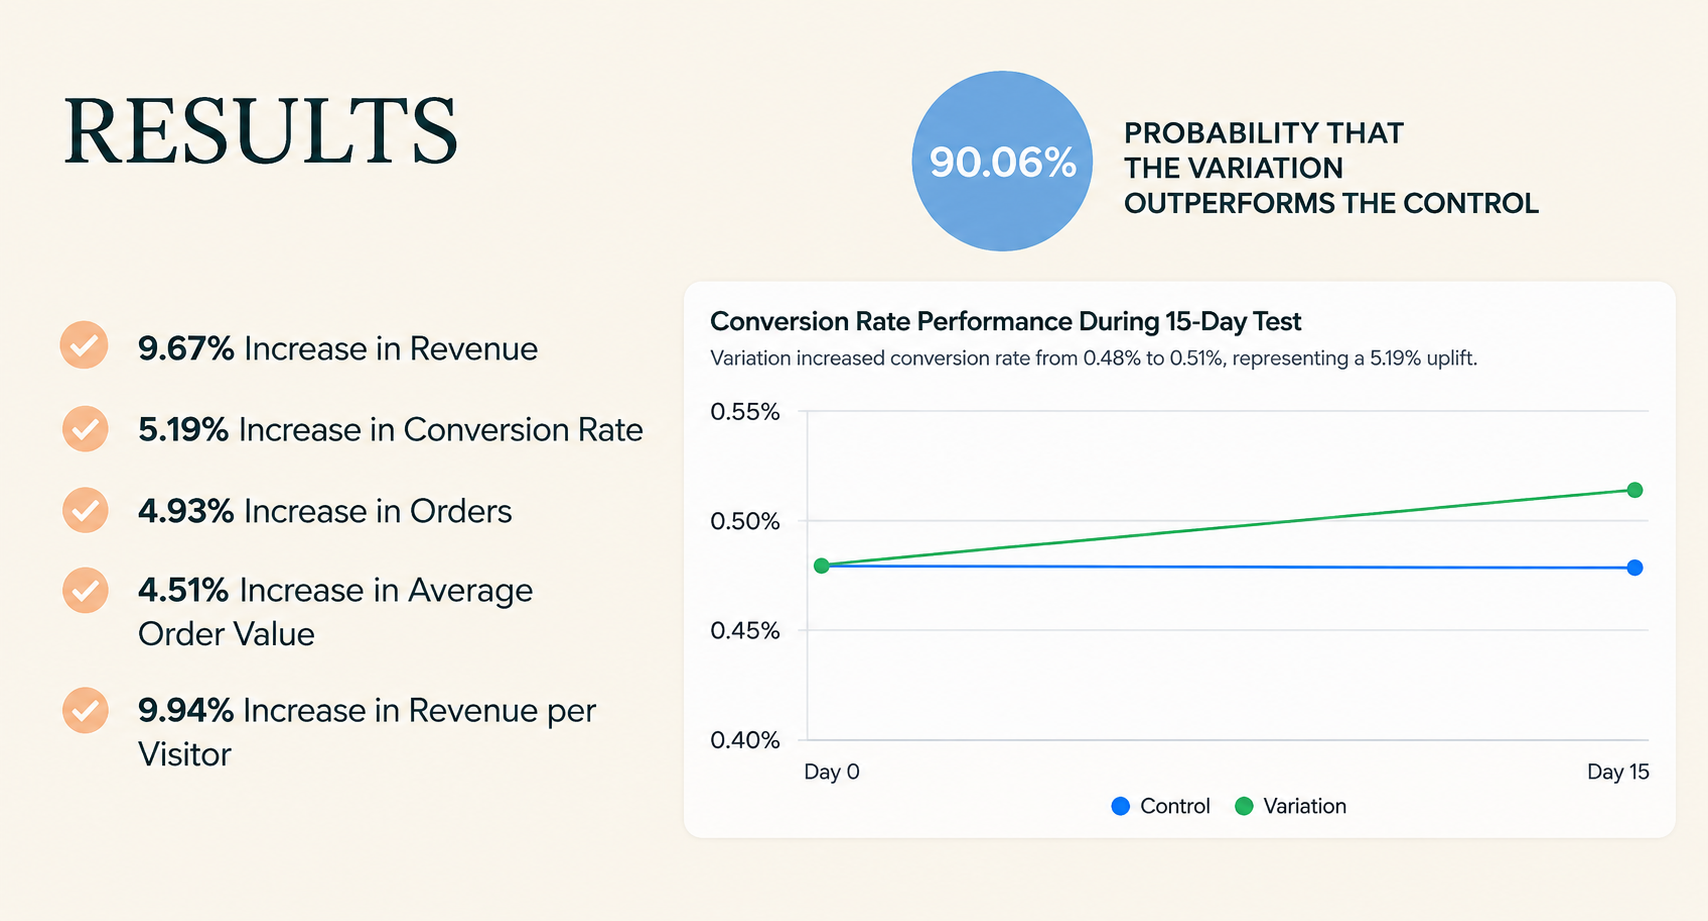
Conversion Rate rose from 3.80% to 4.00%, a 5.19% increase. Orders rose 4.93%. Revenue rose 9.67%, with AOV up 4.51% and Revenue per Visitor up 9.94%. The variation had a 90.06% probability of being the best-performing version, against 9.94% for the control.
Group by purpose, not only by name. The items in the menu did not change. Placing them under headings that describe a job, such as engine and boost or cooling, made the list faster to read.
Structure supports bigger baskets. Revenue rose more than conversion, and AOV rose 4.51%. Shoppers who could see how products relate may have found more of what they needed in one visit.

Read the confidence measure with care. This test reports a 90.06% probability that the variation is best, which is a different measure from statistical significance. It is a good signal, and continued monitoring would confirm the size of the lift.
Mr. Tuning’s mobile shoppers were not missing products. They were scanning a long, flat list to find them. By grouping sub-categories under clear headings, OptiPhoenix made the menu easier to read. Revenue rose 9.67% and Conversion Rate rose 5.19%.