SAADAA × OPTIPHOENIX: A SIZE SELECTION REDESIGN DROVE A 20% CONVERSION RATE UPLIFT

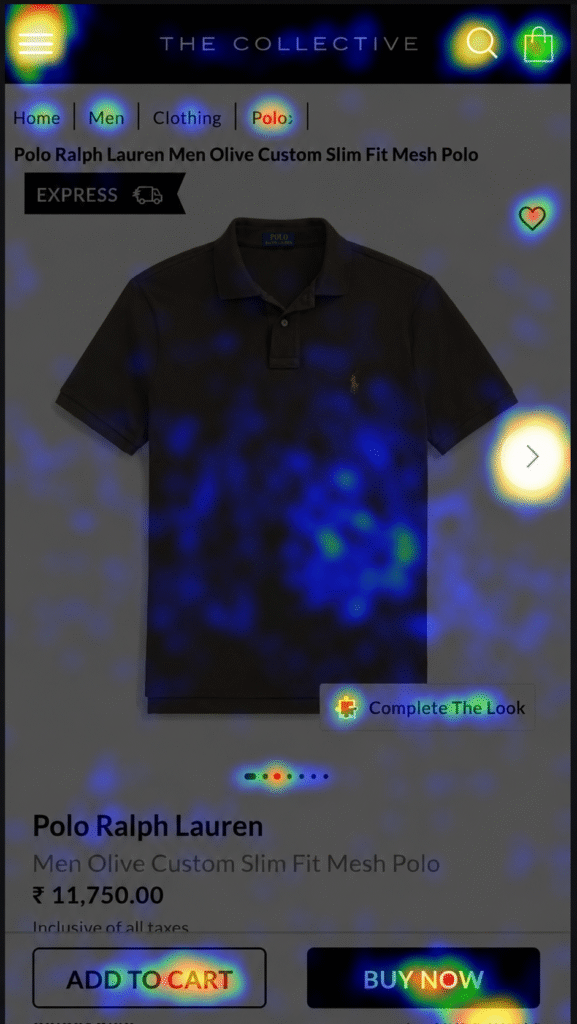
On The Collective’s product detail page, two CTAs competed for the same user attention: “Add to Cart” and “Buy Now.” Most users clicked “Buy Now” first. By click share alone, it looked like the dominant path to purchase.
But the data told a more complicated story.
Users who went through “Add to Cart” converted at a 53.7% higher rate. Their average order per visit was 66.6% higher. They were also buying roughly twice as many units per order. “Buy Now” was the more clicked CTA and the worse-performing one.
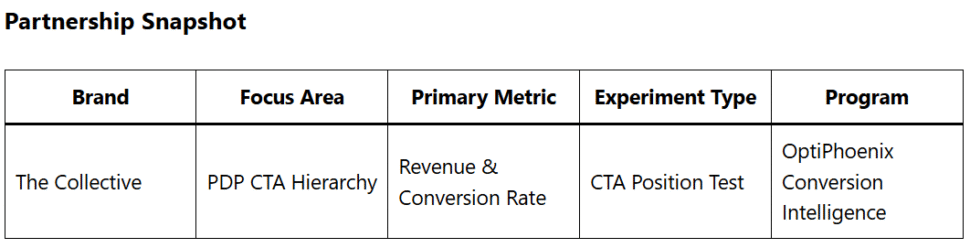
OptiPhoenix partnered with The Collective to test whether giving “Add to Cart” the primary position would shift user behavior in a measurable way.
The insight was about decision sequencing.
“Buy Now” shortcuts the shopping process. It moves users directly to checkout without giving them time to consider adding more items. “Add to Cart” extends the session, keeps the buyer in a browsing mindset, and correlates with larger, more deliberate orders.
For a luxury fashion retailer where average order values are high and product consideration matters, the fast-purchase path was actively working against revenue.
If “Add to Cart” is given visual primacy over “Buy Now” on the PDP, more users will take the higher-converting path, increasing both conversion rate and units per order.
OptiPhoenix designed a focused A/B test with one structural change:
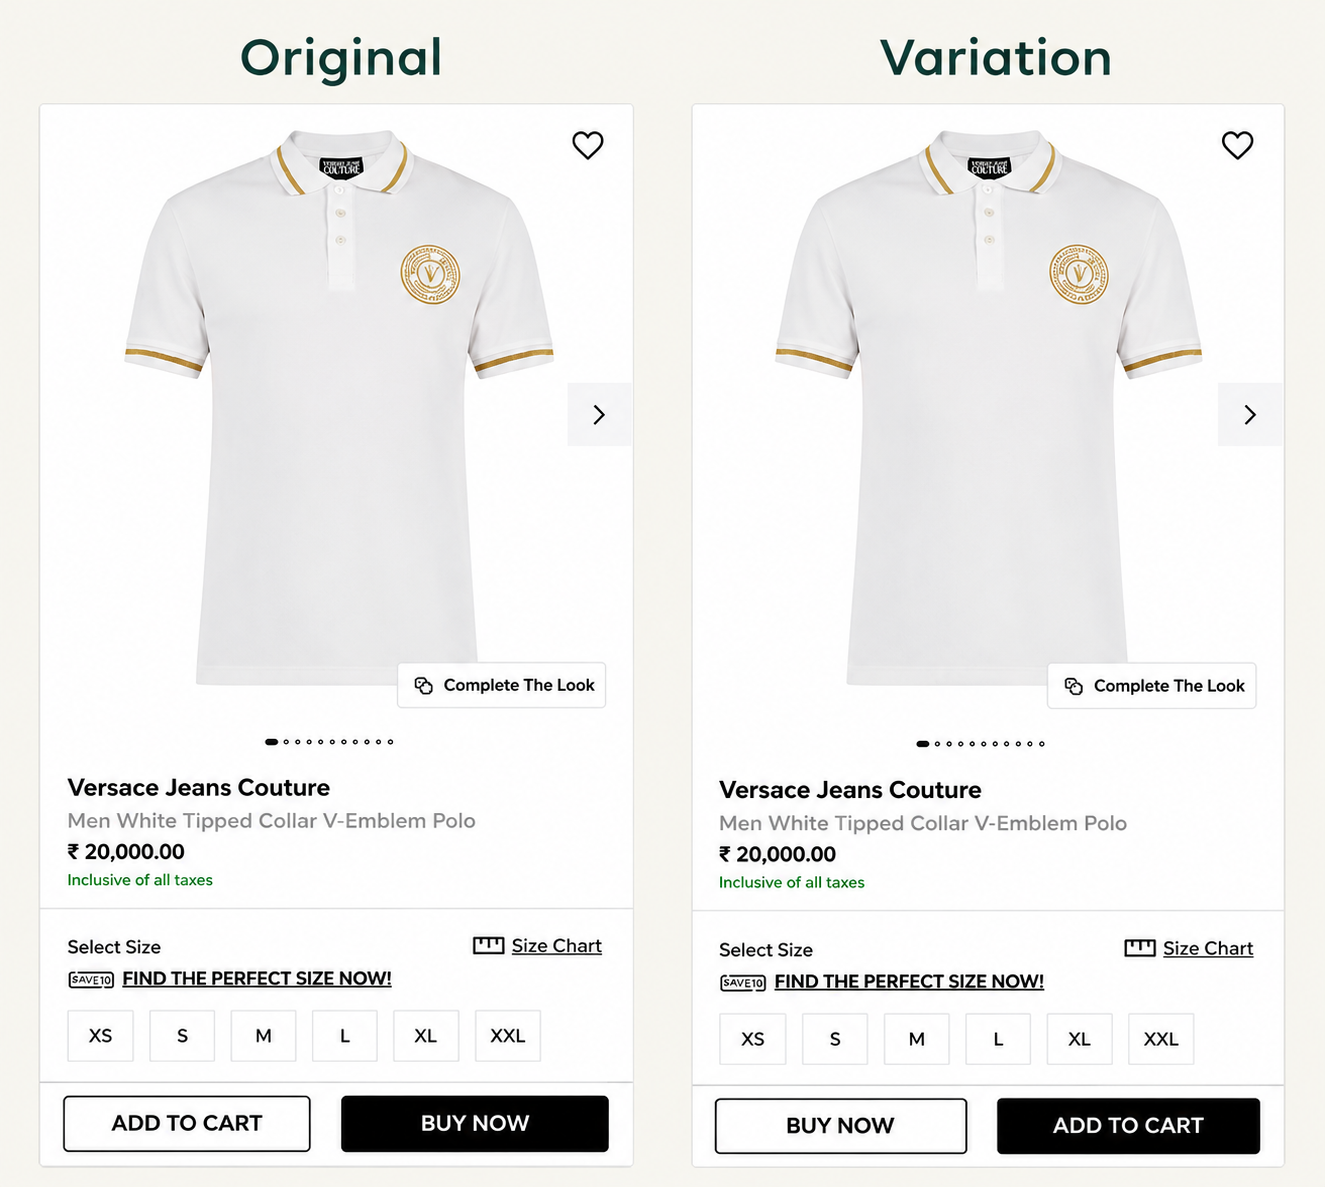
Variant A (Control): Original CTA layout – “Add to Cart” on the left, “Buy Now” on the right as the visually dominant button.
Variant B (Test): CTAs swapped – “Add to Cart” repositioned as the primary, more prominent CTA, with “Buy Now” moved to secondary position.
No changes to product copy, imagery, pricing, or any other page element.
Duration: 5 weeks Metrics Measured: Conversion rate, units per order, revenue
The swap produced consistent improvement across all measured metrics over the full five-week period.
Conversion rate increased by 8.61%. Units per order grew by 6%. Revenue increased by 11.44%.
Giving users the more deliberate path as the default option changed how they shopped.

A single positional change on the PDP produced an 11.44% revenue increase – without altering product, price, or any other element of the experience.
Click volume and conversion quality are different signals. The most-clicked element on a page is not necessarily the one driving the best outcomes. Measuring downstream behavior matters as much as measuring surface interactions.
Purchase path design influences basket size. When the default route keeps users in a browsing state before committing, they tend to buy more.
Small structural changes carry behavioral weight. No copy was rewritten. No design overhaul was needed. The button that appeared on the right moved to the left, and revenue followed.
This experiment confirmed something OptiPhoenix observes consistently: on e-commerce PDPs, the path you make easiest is the path most users take. The Collective’s customers were not choosing “Buy Now” because it suited them. They were choosing it because it was the most visible option.
When the page was redesigned around the path that produces better outcomes for both the buyer and the brand, the results followed within weeks.