SAADAA × OPTIPHOENIX: A SIZE SELECTION REDESIGN DROVE A 20% CONVERSION RATE UPLIFT
After the first hamburger menu redesign demonstrated that visual navigation improved conversion, OptiPhoenix and Salty had a more specific insight to work with: users on this site convert better when images are present in the decision-making experience.
The first iteration had introduced category images alongside list items. The data validated the direction. The question was how far that principle could be extended – and whether a more immersive menu format, built entirely around visual subcategory browsing, would carry the conversion lift further.
The V1 menu redesign improved hierarchy and added images, but the layout remained a vertically scrolling list with images attached to entries. The fundamental structure had not changed.
A two-column full-screen menu offered a different model: the left column would display main categories with the first one selected by default, and the right column would immediately surface subcategory images for that selection. Users could see product-level visual cues the moment the menu opened, without any interaction required.
The insight from V1 – images drive progression – could be applied at a more fundamental structural level if the menu’s format itself was built around image-led subcategory browsing.
If the hamburger menu is redesigned as a full-screen two-column layout where the first category is selected by default and its subcategories with images are immediately visible on the right panel, users will engage with subcategories at a higher rate and convert more frequently.
Variant A (Control): V1 redesigned menu – category images alongside list items, icons, sticky secondary links.
Variant B (Test): Full-screen two-column menu – left column shows main category list, right column immediately displays subcategory images for the default-selected first category. Users can tap any main category to see its subcategories with images populate the right panel instantly.
Sample size: ~14,500–14,900 users per variant
Primary Metrics: Conversion rate, subcategory interaction, funnel progression
Statistical confidence: 90.33% probability to be best
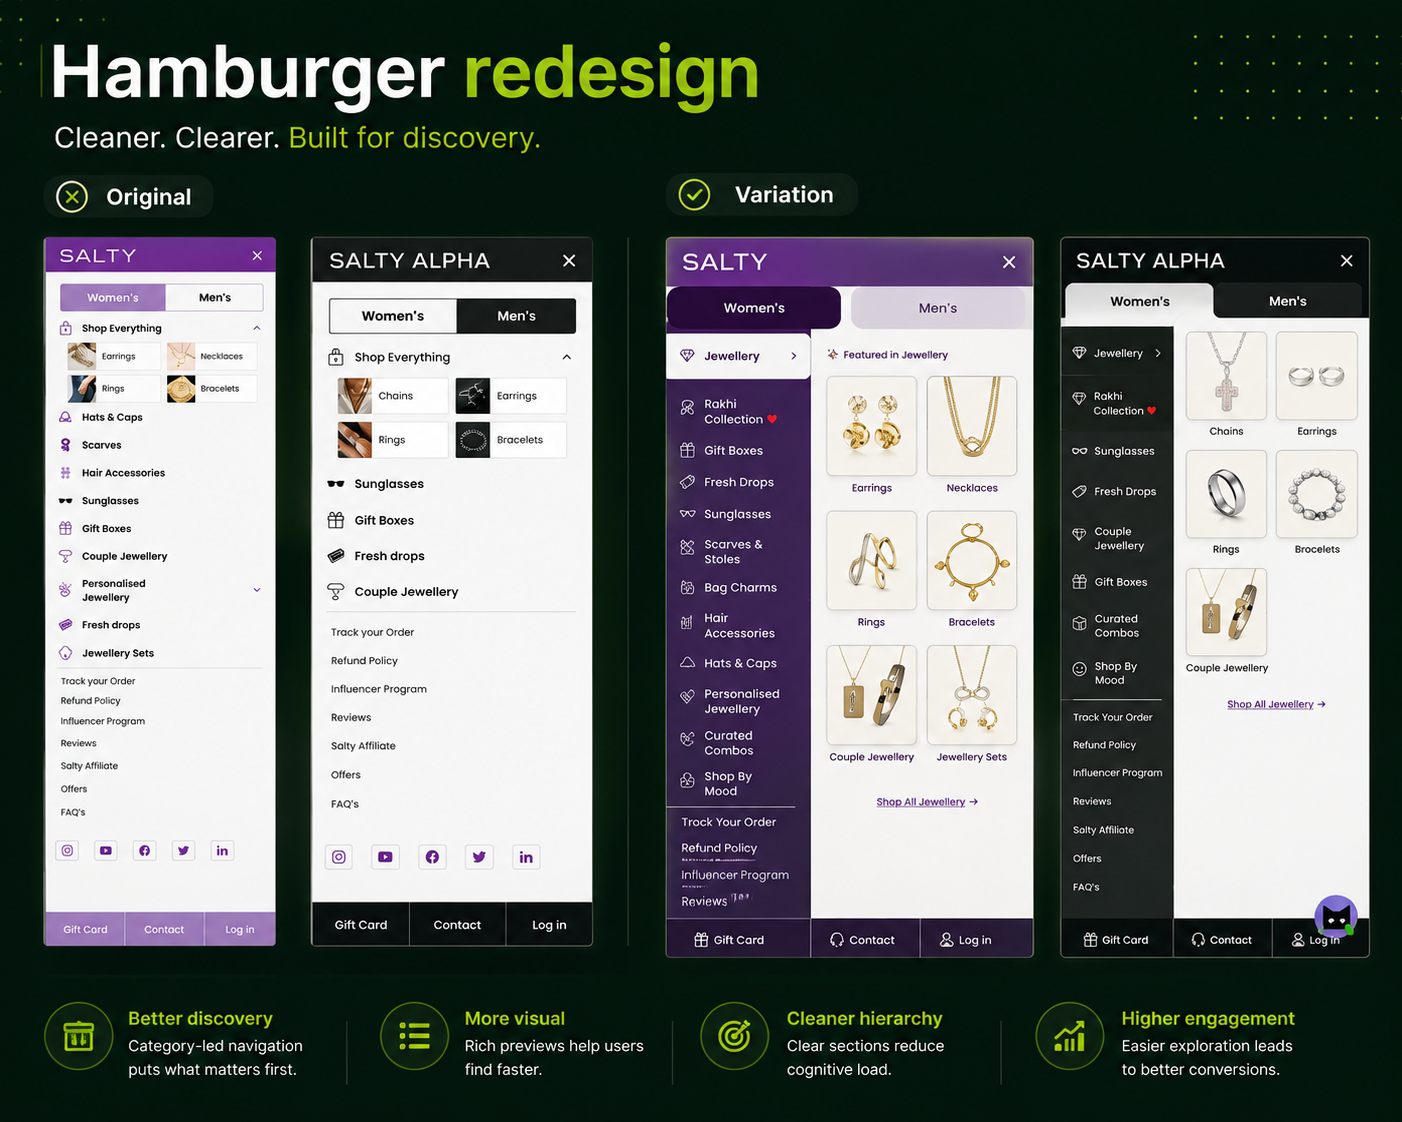
Control conversion rate: 2.066%. Variation conversion rate: 2.288%. Uplift: 10.76% more funnel progressions to purchase. The variation also drove 32% additional interaction with subcategories, confirming the structural change was driving deeper engagement before navigation.
Statistical significance: 90.33% probability to be best, with expected loss of only 3.21% versus 12.11% for the control.
The improvement projects to approximately 3.3% of Salty’s annual revenue in additional yearly impact at current traffic levels.
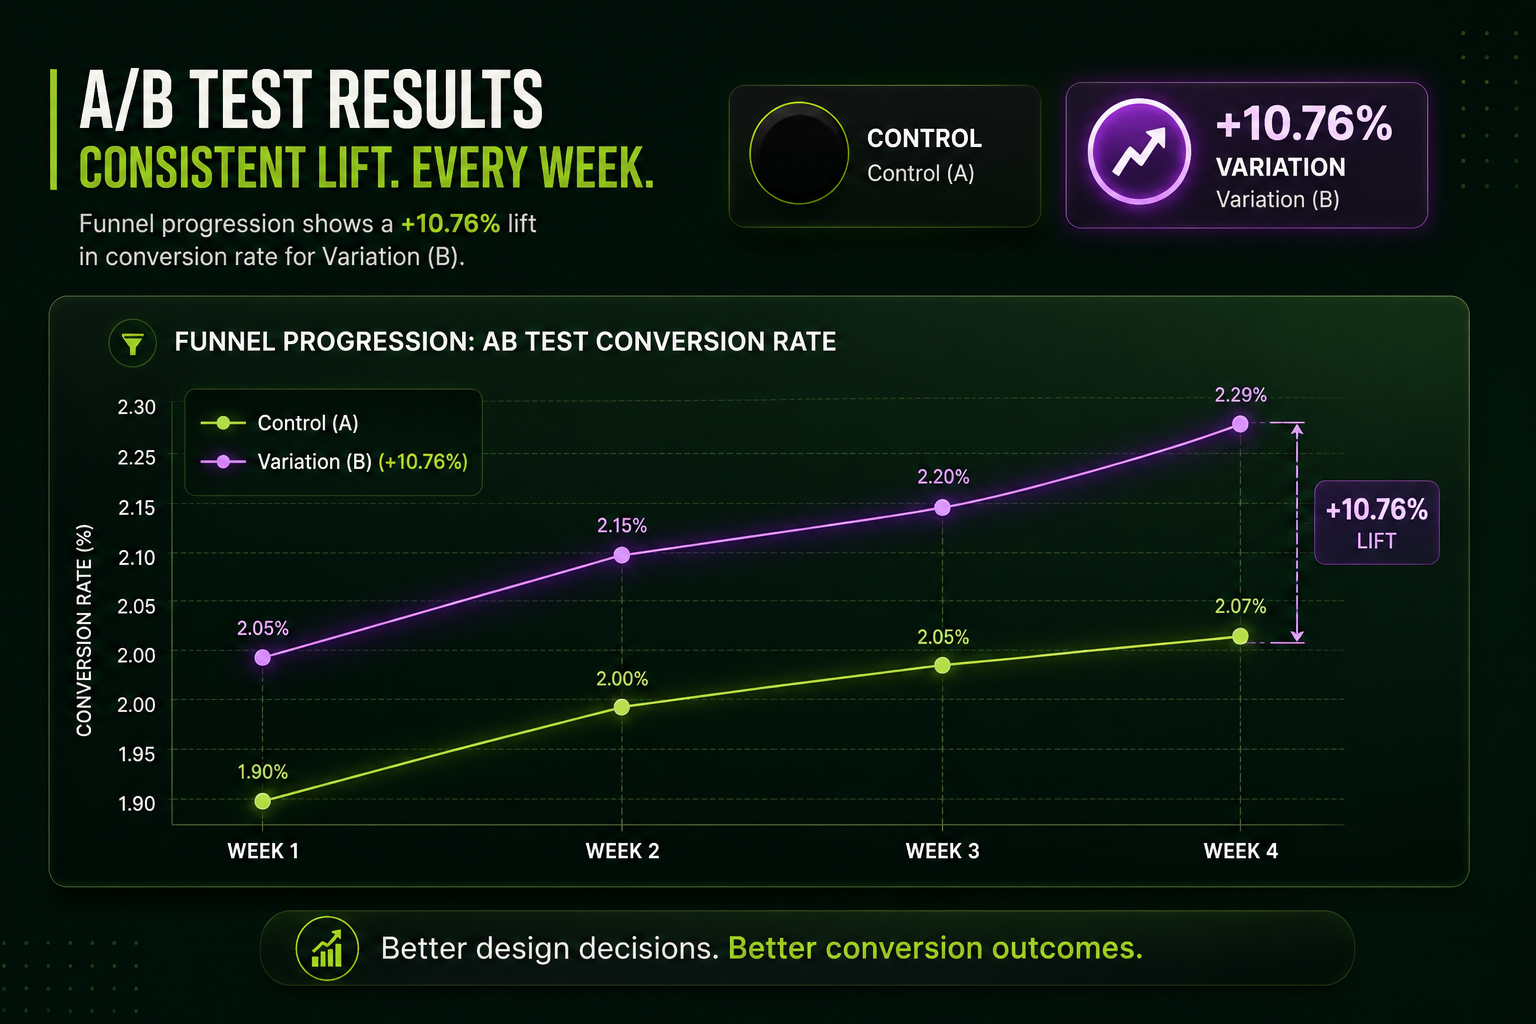
Image-led navigation compounds when the format fully commits to it. V1 attached images to list items. V2 built the format around images. The structural difference produced a meaningfully larger conversion uplift.
Default selection removes a decision step. By loading the first category’s subcategories automatically, users received visual product context without any tap. Eliminating that one interaction reduced the effort between opening the menu and being exposed to products.
Experimentation built on prior learning compounds faster. The V2 hypothesis was only possible because V1 established what worked. Each test informed the next. That accumulation of evidence is what separates an experimentation program from a series of disconnected guesses.

The second menu experiment didn’t repeat the first – it extended it. V1 proved that images in navigation drive conversion. V2 asked what happens when the entire menu format is redesigned around that principle. The answer was a 10.76% conversion uplift and a projected ~3.3% annual revenue impact, built on the compounding logic of iterative experimentation.