MR. TUNING × OPTIPHOENIX: GROUPED SUB-CATEGORY HEADINGS IN THE MOBILE MENU DROVE A 9.67% REVENUE UPLIFT
SAADAA is a fashion brand selling everyday apparel such as kurtas and pants. On mobile, the hamburger menu is often a shopper’s first route into the catalogue. SAADAA’s menu opened as a long accordion. Shop Women and Shop Men sat as sections that expanded in place, followed by a long text list of collections and pages. Showing a few categories pushed the rest further down the screen, and the menu gave little sense of the products behind each label.

OptiPhoenix partnered with SAADAA to test whether a redesigned menu would help shoppers find products faster and improve conversion.
A text-only list tells a shopper what a section is called. It does not show what is inside it.
On a small screen, a long accordion adds more effort. Shoppers expand a section, scroll past labels, and tap deeper to find out whether a category is relevant. So the gap sat between a catalogue full of products and a menu that asked shoppers to open each level before they could see any of them.
OptiPhoenix proposed redesigning the mobile hamburger menu so that Women and Men categories were easier to switch between and browse. Showing categories and product imagery directly in the menu was expected to help shoppers reach relevant products faster and lift conversion.

OptiPhoenix ran a controlled A/B test on SAADAA’s sitewide mobile hamburger menu, with all users in the segment. The test ran for 16 days, from 25 April to 11 May.
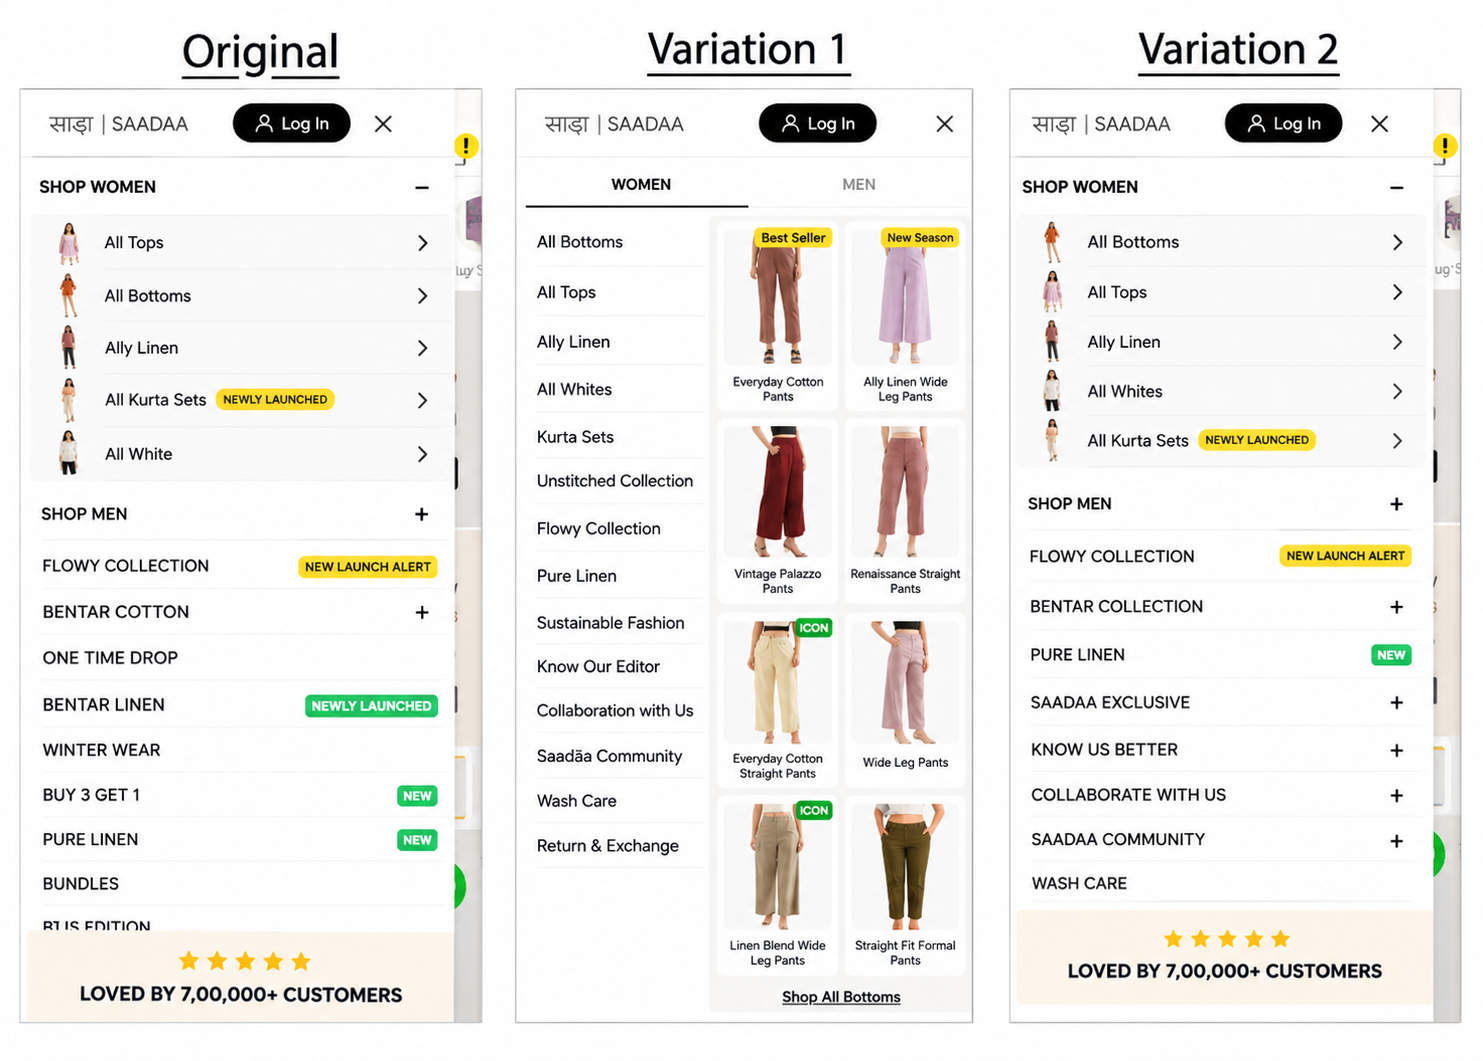
Variant A (Control): The original accordion menu, with Shop Women and Shop Men sections that expanded in place and a long list of collections below.
Variant B (Variation 1): A two-pane menu. Women and Men tabs sat at the top. A category list (such as All Bottoms, All Tops, and Airy Linen) ran down the left, and product image tiles appeared on the right, with a “Shop All” link below.
Variant C (Variation 2): A restructured version of the accordion menu, with the same Shop Women and Shop Men sections.
Metrics measured: Conversion Rate, Revenue per User (RPU), purchases, and Average Order Value (AOV).
Putting categories and products in view, instead of behind expanding sections, moved more shoppers to buy.
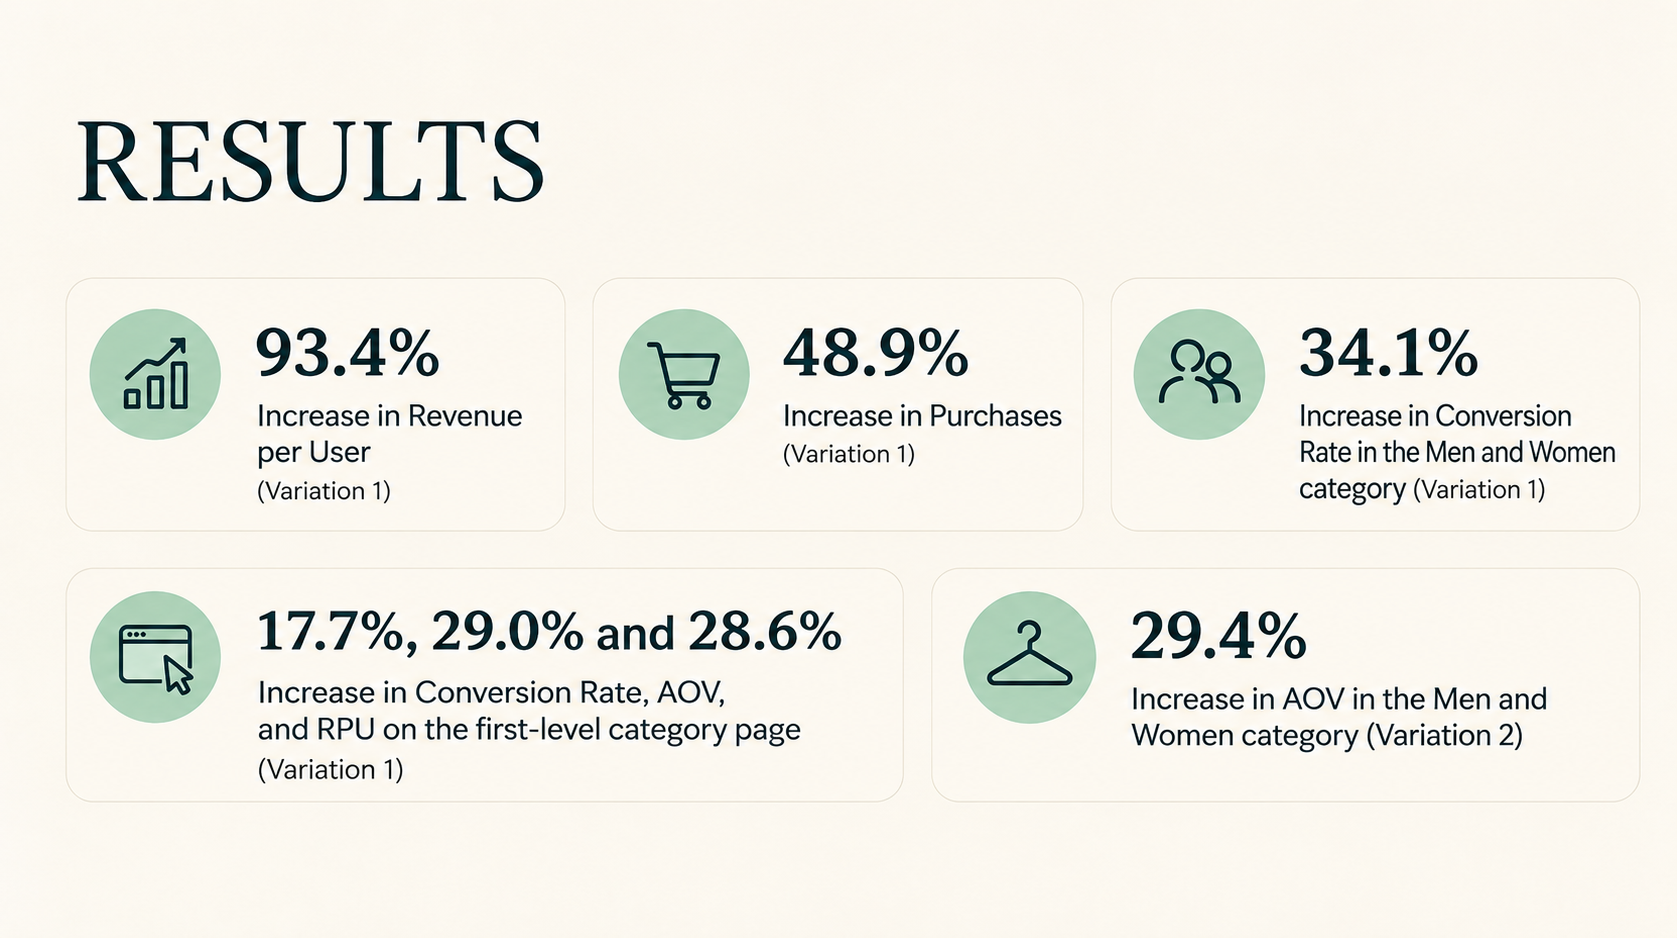
Variation 1 raised Revenue per User by 93.4% and generated 48.9% more purchases. In the Men and Women category, it raised Conversion Rate by 34.1%.
On the first-level category page, Variation 1 raised Conversion Rate by 17.7%, AOV by 29.0%, and RPU by 28.6%. Variation 2 showed the strongest AOV gain in the Men and Women category, at 29.4%.
Show products, not only labels. Variation 1 placed images beside the category list. Shoppers could see what a category held before they tapped into it.

Separate the audiences at the top. Women and Men tabs let shoppers choose their section first and browse only that range, instead of expanding and collapsing long sections.
Menu design affects basket value as well. AOV rose 29.0% on the first-level category page for Variation 1, and 29.4% in the Men and Women category for Variation 2. Both menu designs raised order value, in different parts of the journey.
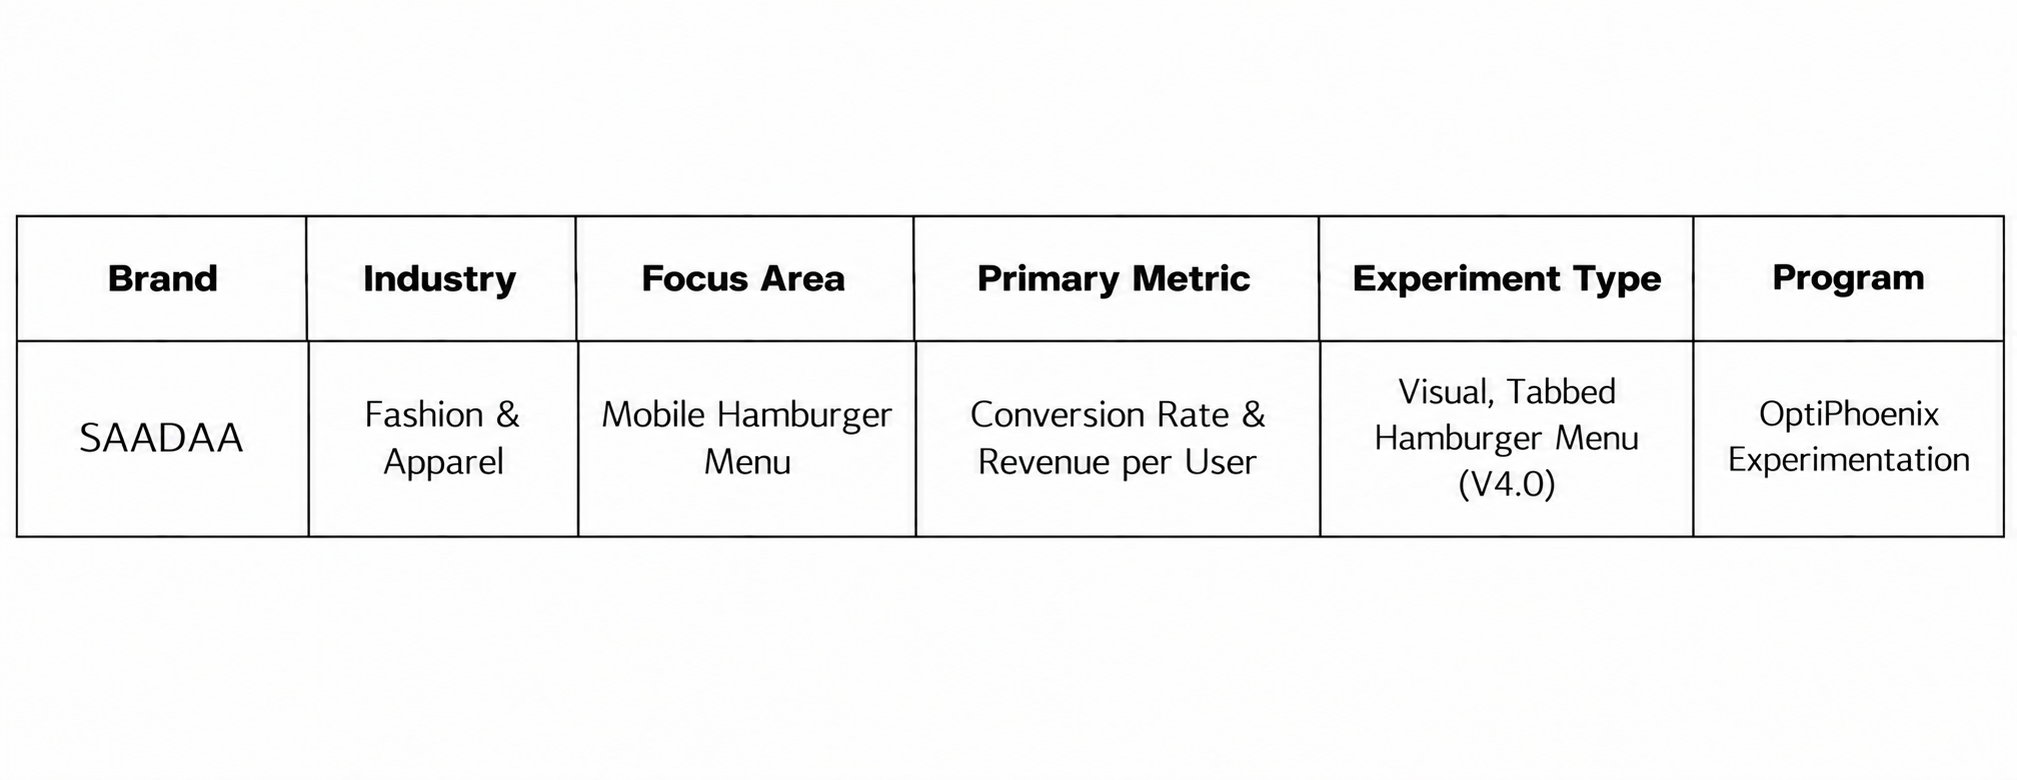
SAADAA‘s shoppers were not short of products. They were working through a long text menu to reach them. By moving to a tabbed menu with category lists and product images, OptiPhoenix put the range in front of them. Revenue per User rose 93.4% and purchases rose 48.9%.