
Competitor Analysis for CRO: What to Learn From Other Sites and What to Ignore

How many A/B tests should you run a month? Ask around and you’ll get a number and the number will sound confident. Monetate, one of the vendors that publishes benchmarks, says itself that no single number or rate of testing guarantees success. We agree. A better question is how many valid decisions your traffic, your team and your ideas can support. This post shows how to work out that ceiling. It also covers what going faster costs you in false wins, and how to set a pace you can defend.

Monetate quotes a Brillmark guide that sorts sites by weekly visitors. At 10,000 to 50,000 visitors a week, it suggests a maximum of 2 to 3 tests a month. At 200,000 or more, it suggests 5 to 10. Monetate’s own ranges run from 1 to 2 tests a month for early-stage teams to 5 or more for enterprise teams. Convert’s guide puts a solo or small team at roughly 2 to 5 a month.
All of these count launches. Invesp defines test velocity the same way, as how many tests you launch in a given period. Counting launches rewards starting tests. It says little about finishing them with a decision you can act on.
Practitioners disagree on what to do about that. In a Kameleoon panel on whether velocity is overrated, Ton Wesseling argued that it’s easier to start with quantity and move to quality later. Els Aerts warned against rewarding quantity for its own sake. We land somewhere between them, and the rest of this post explains where.
Three limits cap your pace, and the lowest one wins.
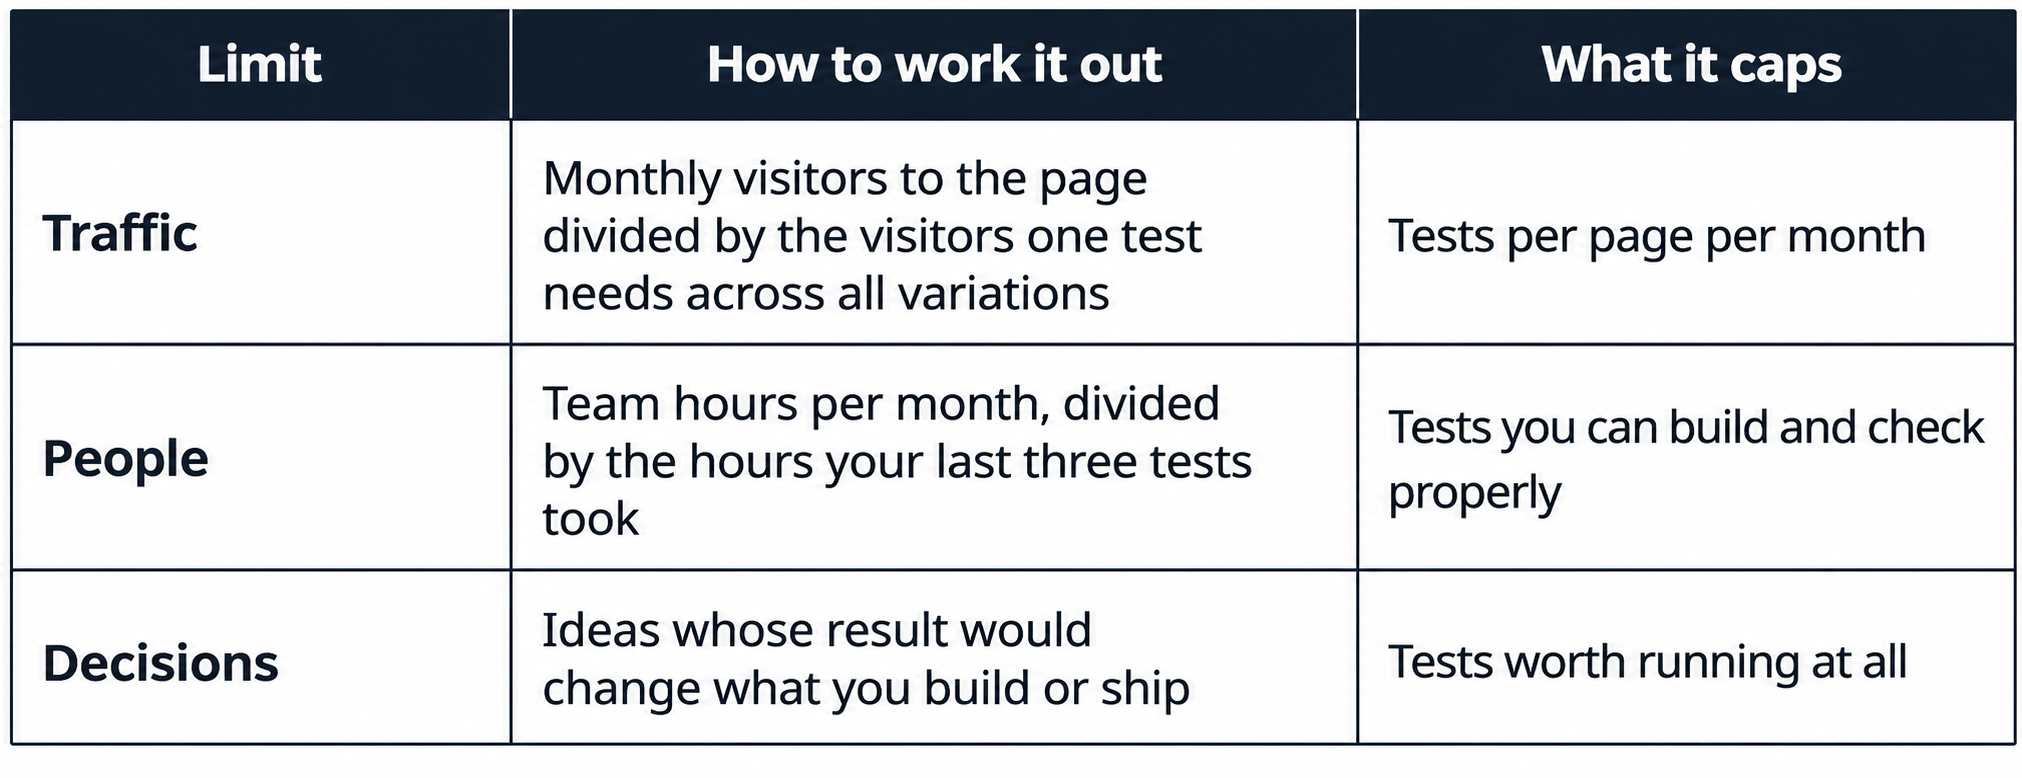
Start with traffic, because you can’t argue with it. Say a product page gets 90,000 visitors a month, and your sample size calculation says each of two variations needs 45,000. That’s 90,000 in total, so one test fills the month and the next one waits. These numbers are made up to show the arithmetic. Repeat the sum for the cart, the homepage and any other area you could test, then add the results.
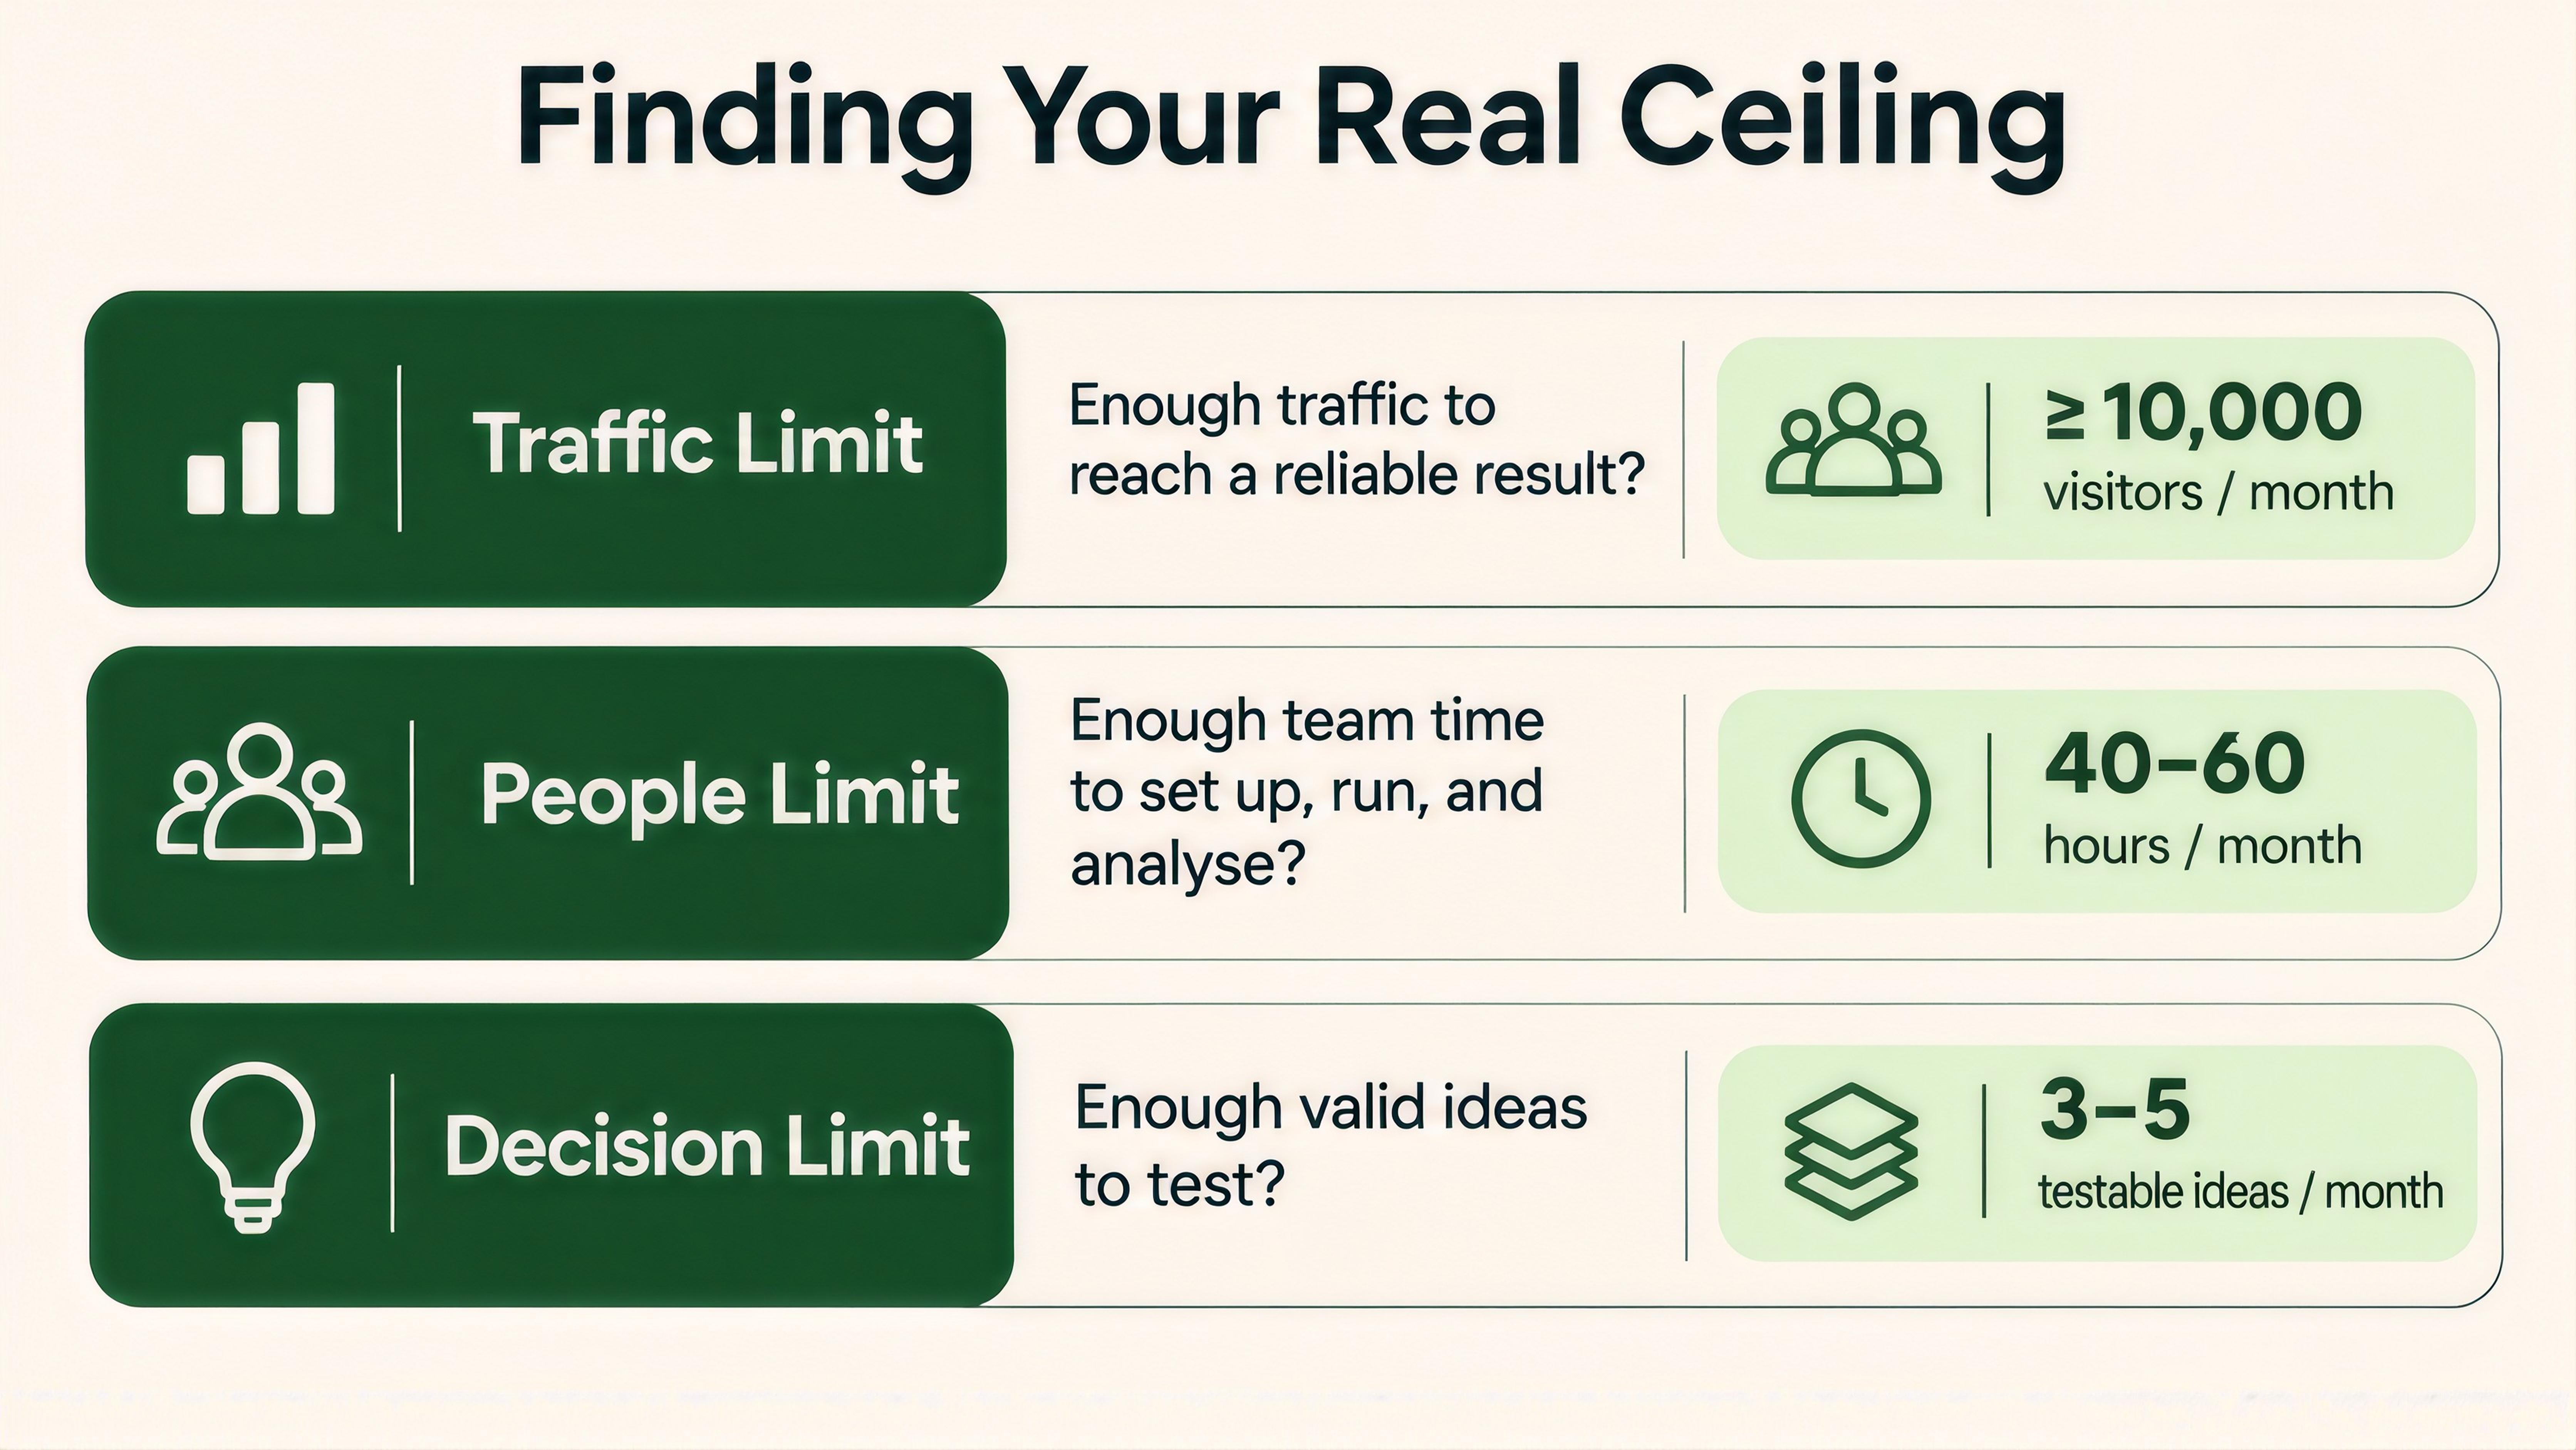
Invesp’s version of capacity is 52 weeks divided by the average test duration, multiplied by the number of pages you can test. It covers traffic well. It leaves out people and decisions.
For people, pull the time your last three tests took from idea to write-up. Count design, build, QA and analysis. Use the middle figure. Then count your decisions honestly. A test whose result changes nothing still uses a slot.
Pace also changes how far you can trust the winners. Ron Kohavi, Alex Deng and Lukas Vermeer work through the math in “A/B Testing Intuition Busters.” Their point is simple. The chance that a significant result is false depends on how often your ideas actually work. Their table estimates it for a few well-known programs, assuming 80% power and a 0.025 threshold.
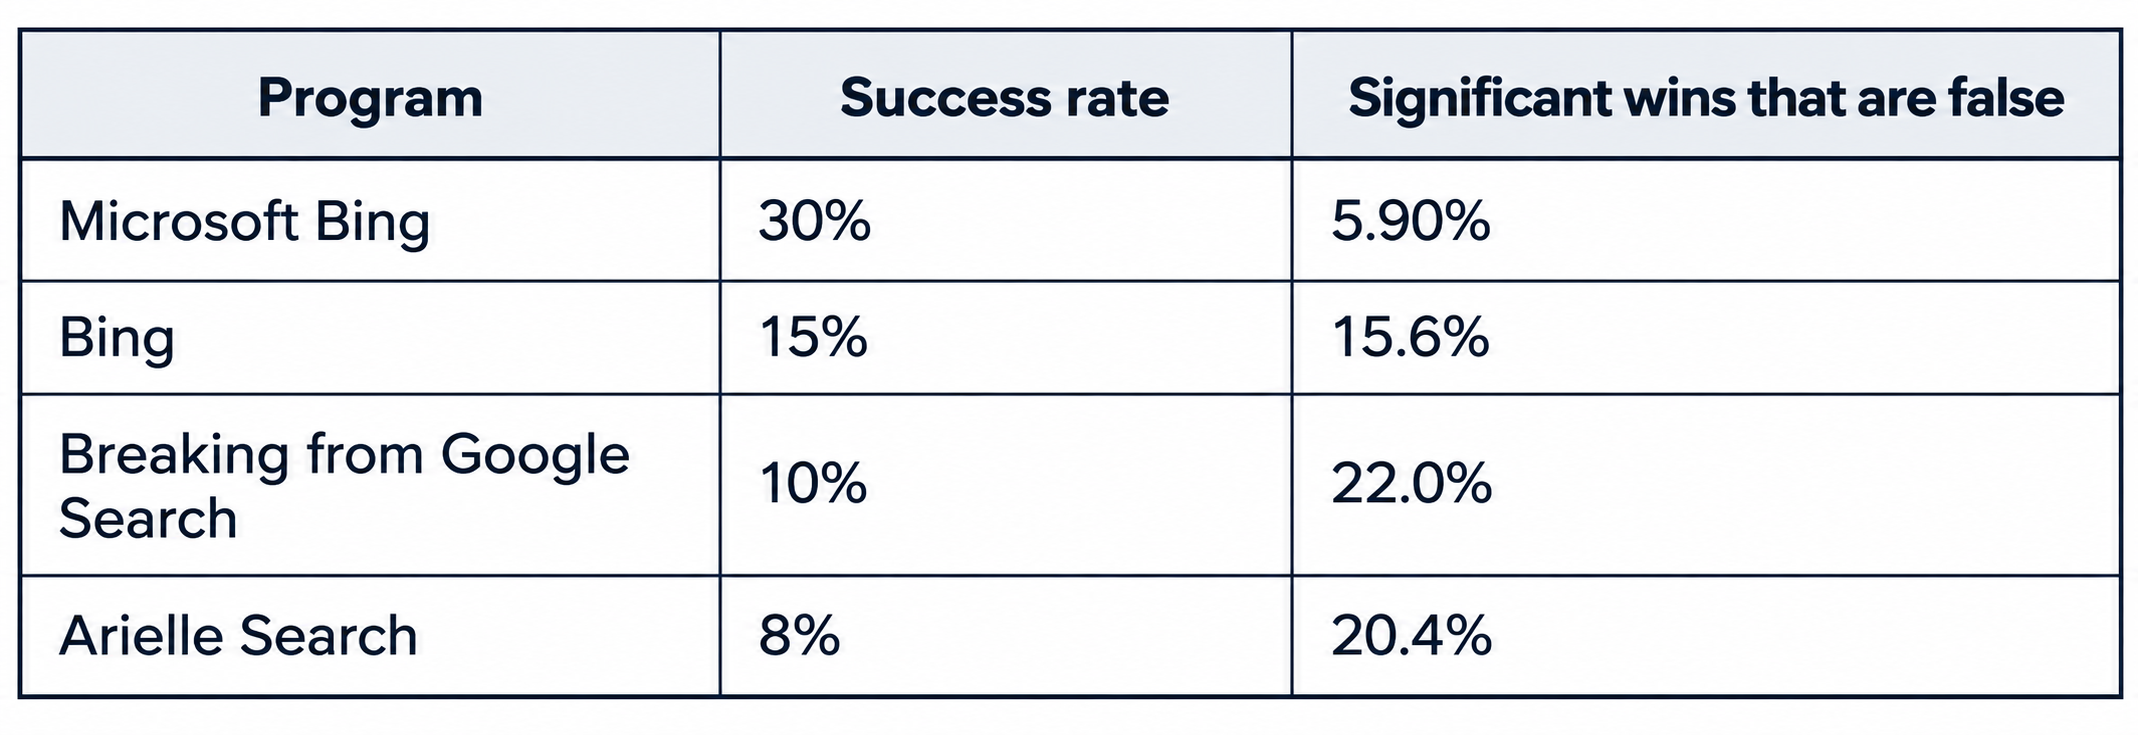
The authors call the success rates ballpark estimates, noting that “we never know the true rates.”
Read the bottom row plainly. When only 8 in 100 ideas work, about a quarter of the significant results are noise at standard settings. If your push for speed means testing weaker ideas, your success rate drops and your false wins rise with it.
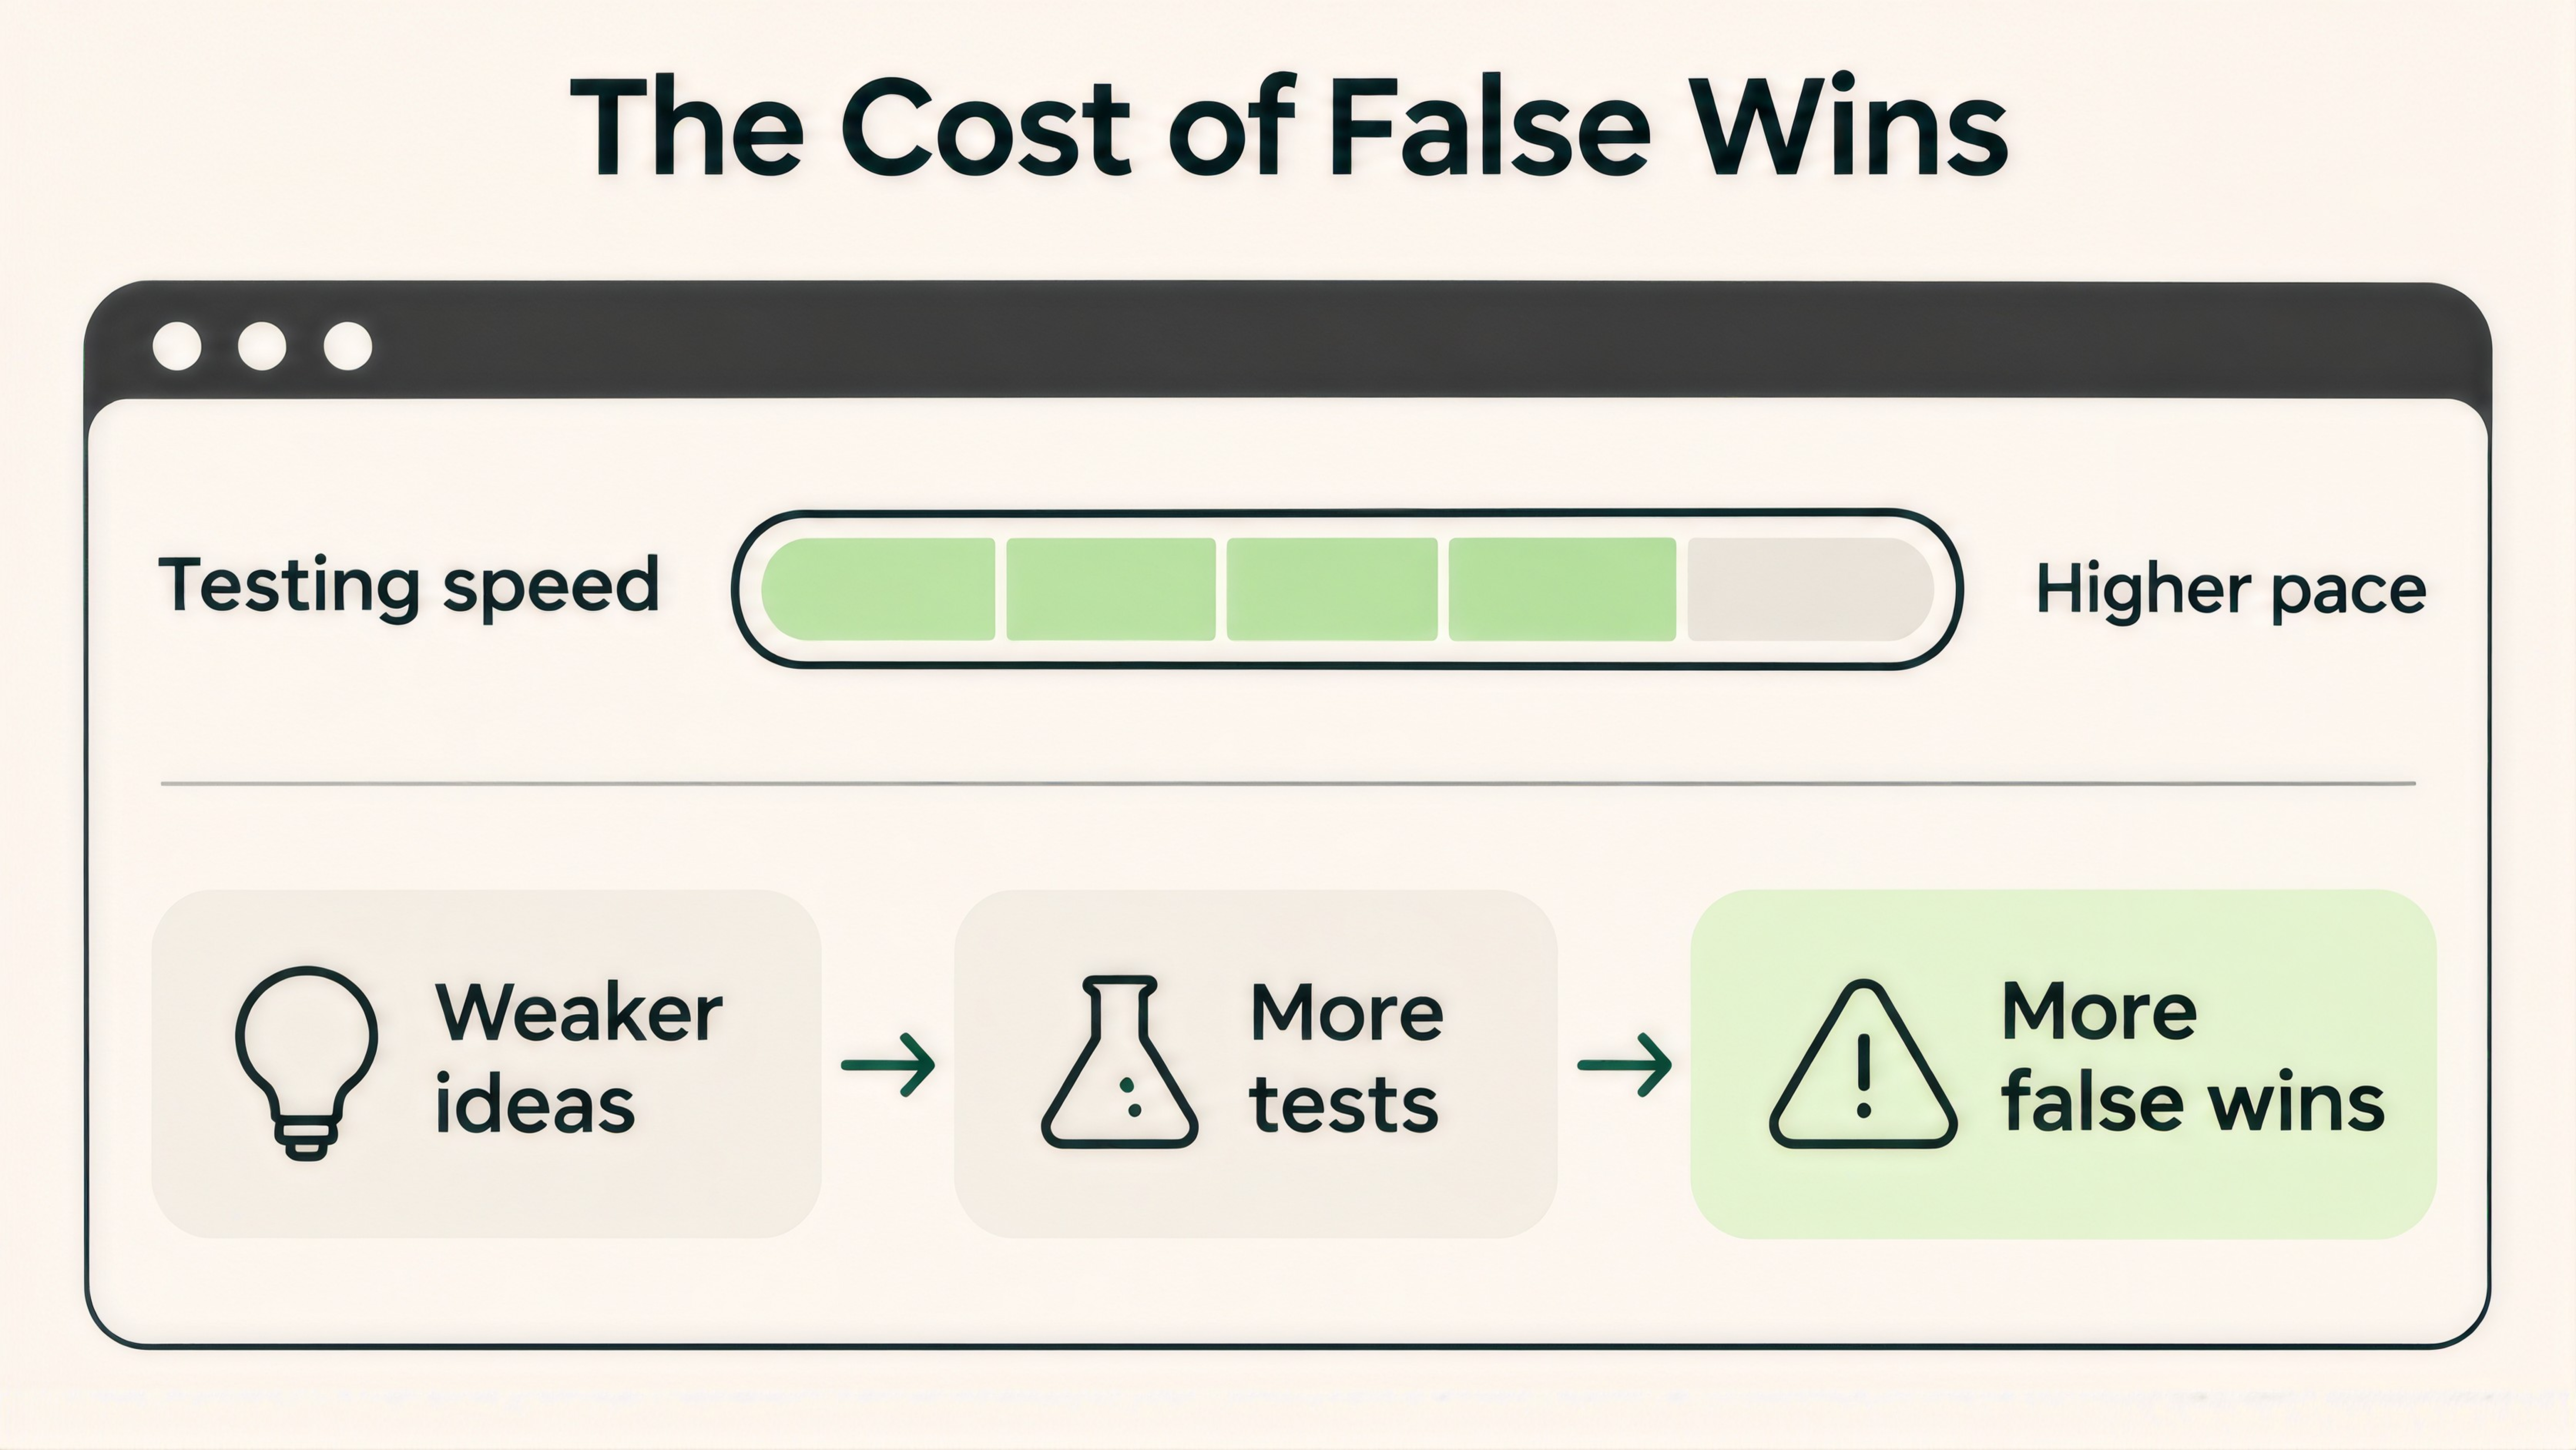
We can’t tell you your own rate. You can find it. Log every outcome for a few months and count the wins. The paper argues that surprising results need stronger evidence, with lower p-values. We’d add a habit of our own. Re-run a big, surprising win before you build on it.
Brian Massey said in the same Kameleoon panel that tests have a cost. Invesp’s piece makes a similar point through Shiva Manjunath, who warns that fifty button color tests won’t produce useful insight.
We wouldn’t ban small tests. New teams need repetitions to build the process, and Marianne Stjernvall’s point holds, since experience comes from running tests. But every test should carry a hypothesis and a decision.

Process matters more than pace here, and Invesp’s advice is practical. Have several people check every variant before launch. Record the losing and inconclusive tests along with the winners. Prepare the next test before the current one ends. Jeremy Epperson of Conversion Guides suggests spending the first 90 days on process and documentation.
Can you run two tests at once? Usually, yes. Google’s team built an overlapping experiment infrastructure for exactly this, to run more experiments on the same traffic. Monwhea Jeng of Microsoft’s experimentation platform team looked at four major products, each running hundreds of tests a day. For three, the team found no interactions. For the fourth, abnormal results showed up in 0.002% of test pairs. His conclusion is that interactions are rare enough that you can usually run your tests without worrying about them.
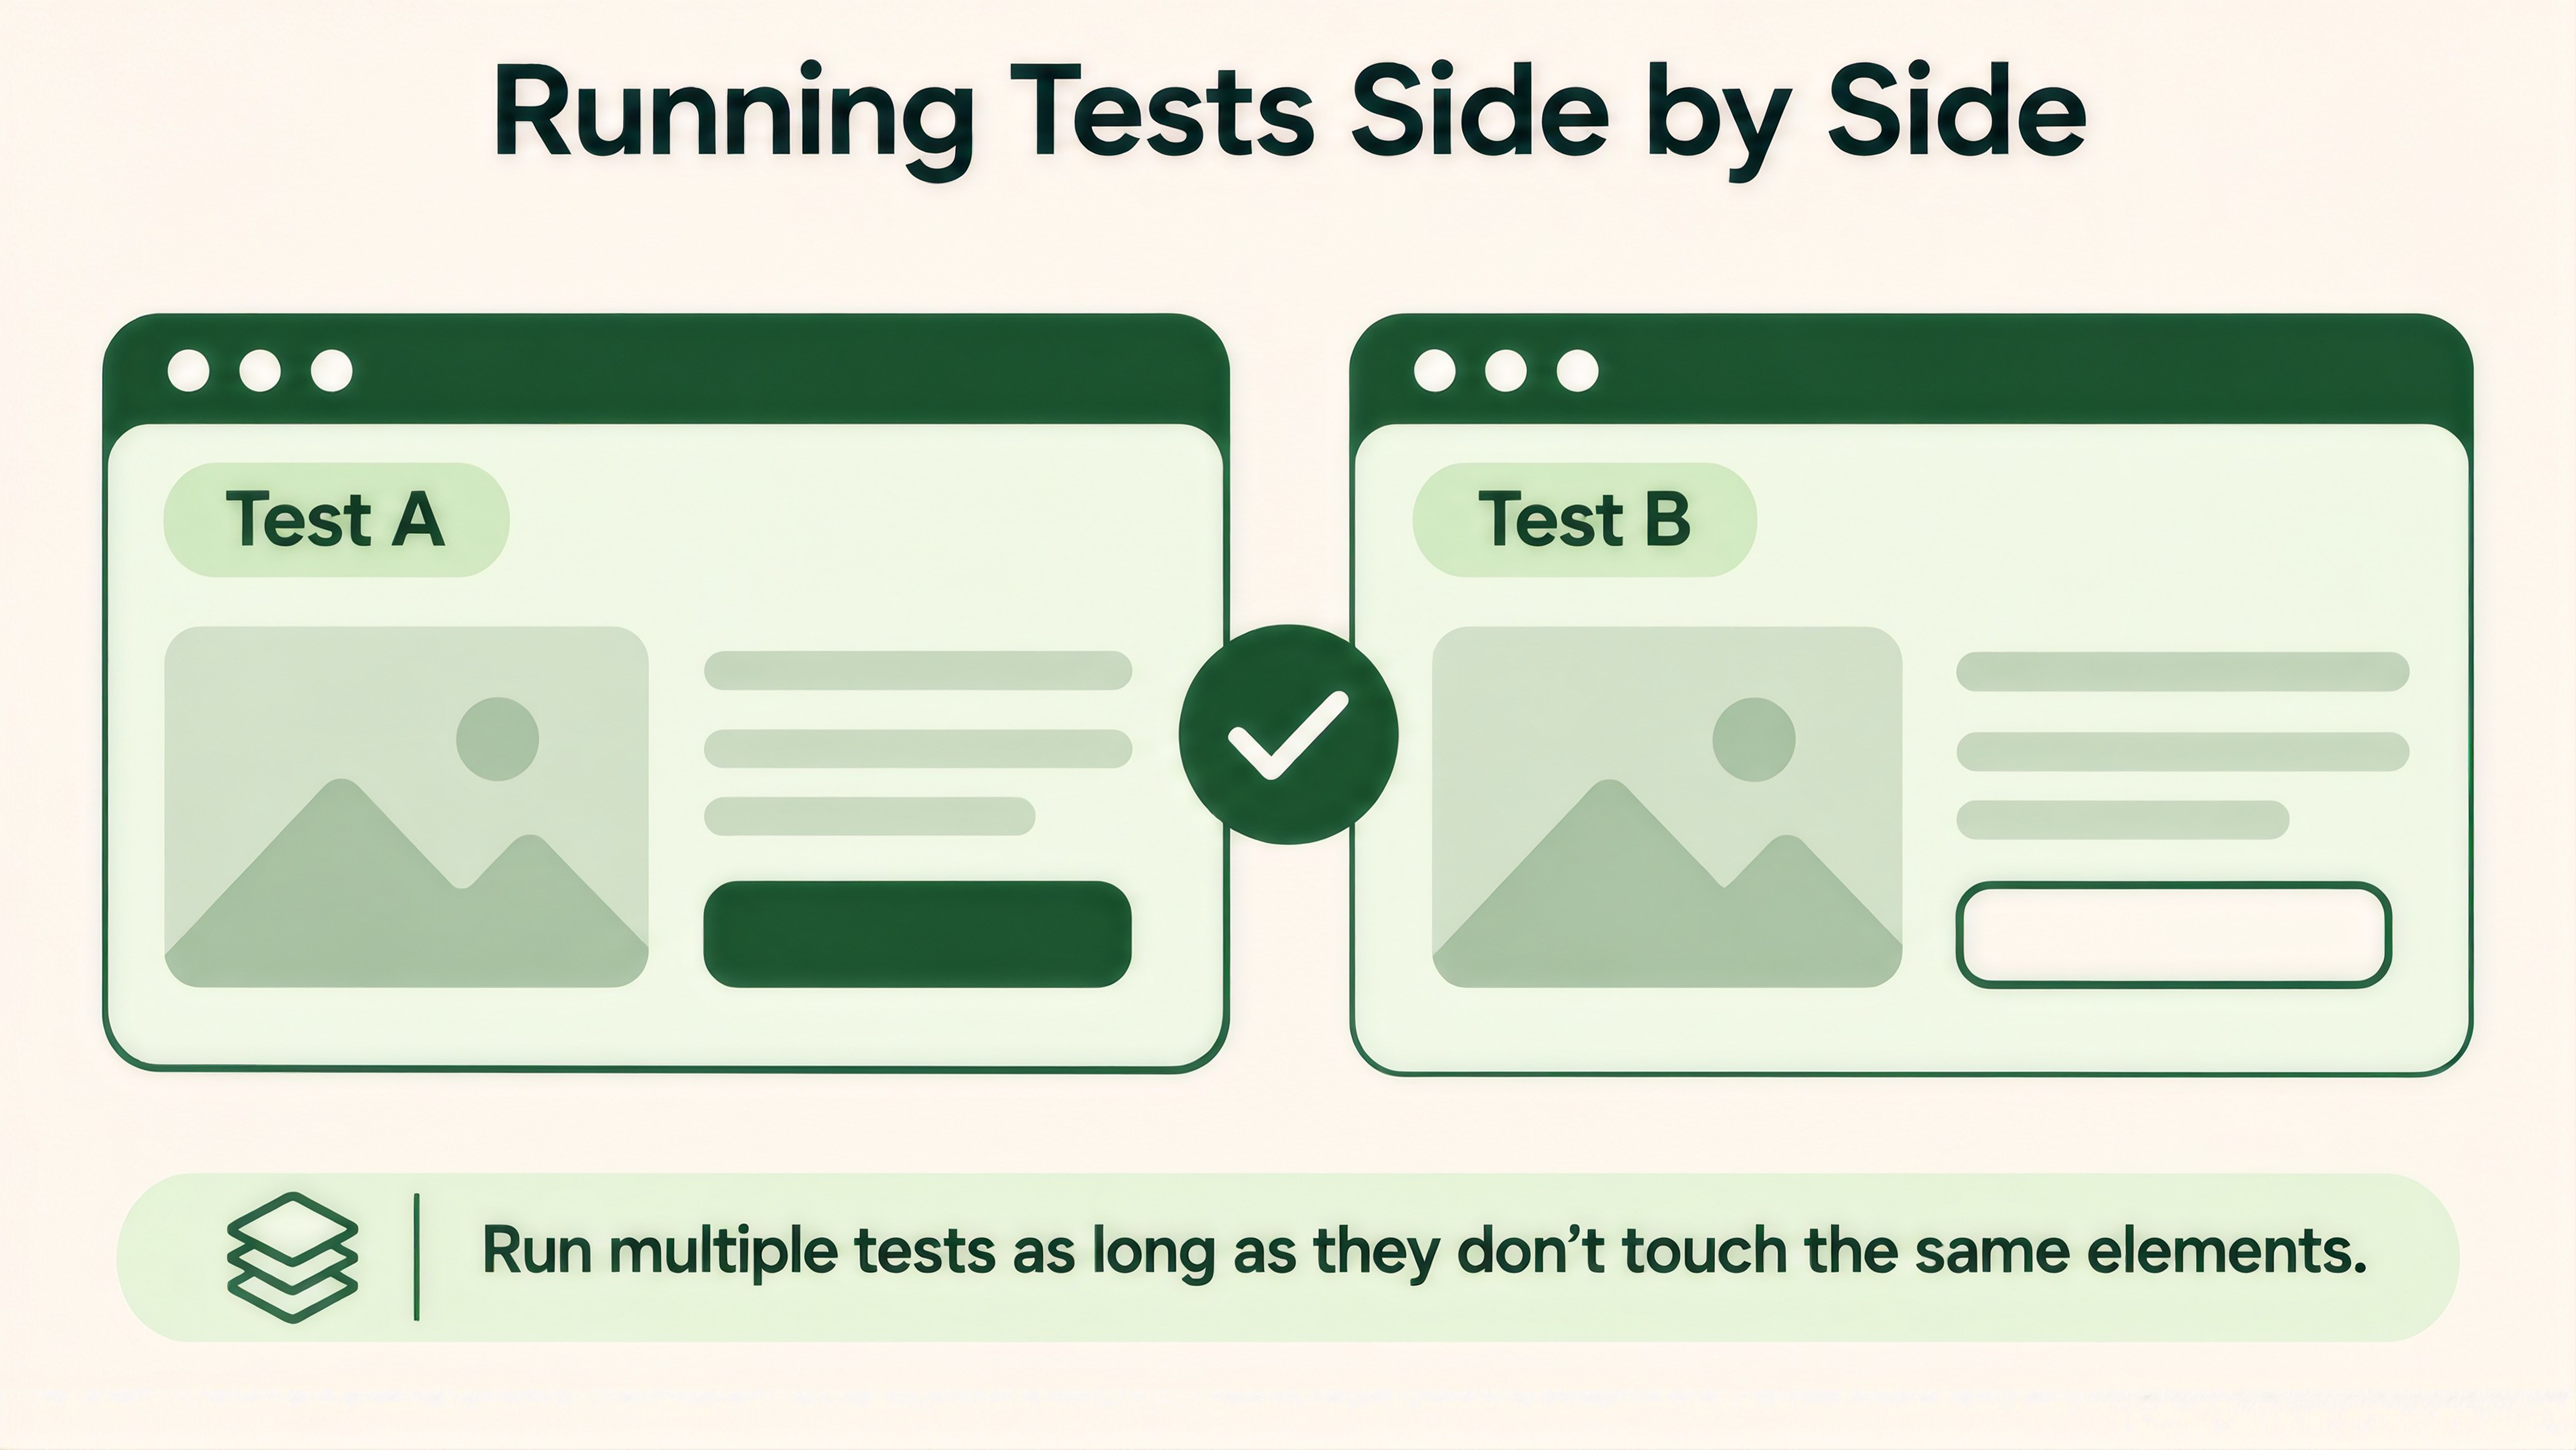
He also says not to drop your guard. Some pairs, such as conflicting visual changes, do interact, and he advises running your own meta-analysis of interaction effects.
For a smaller site, that gives you a simple rule. Don’t run two tests that change the same element or block. Tests on different pages can run together. And check the traffic split on every test, since a busy calendar gives a broken setup more chances to slip through. Our post on the technical side of broken A/B test data explains what to look for.

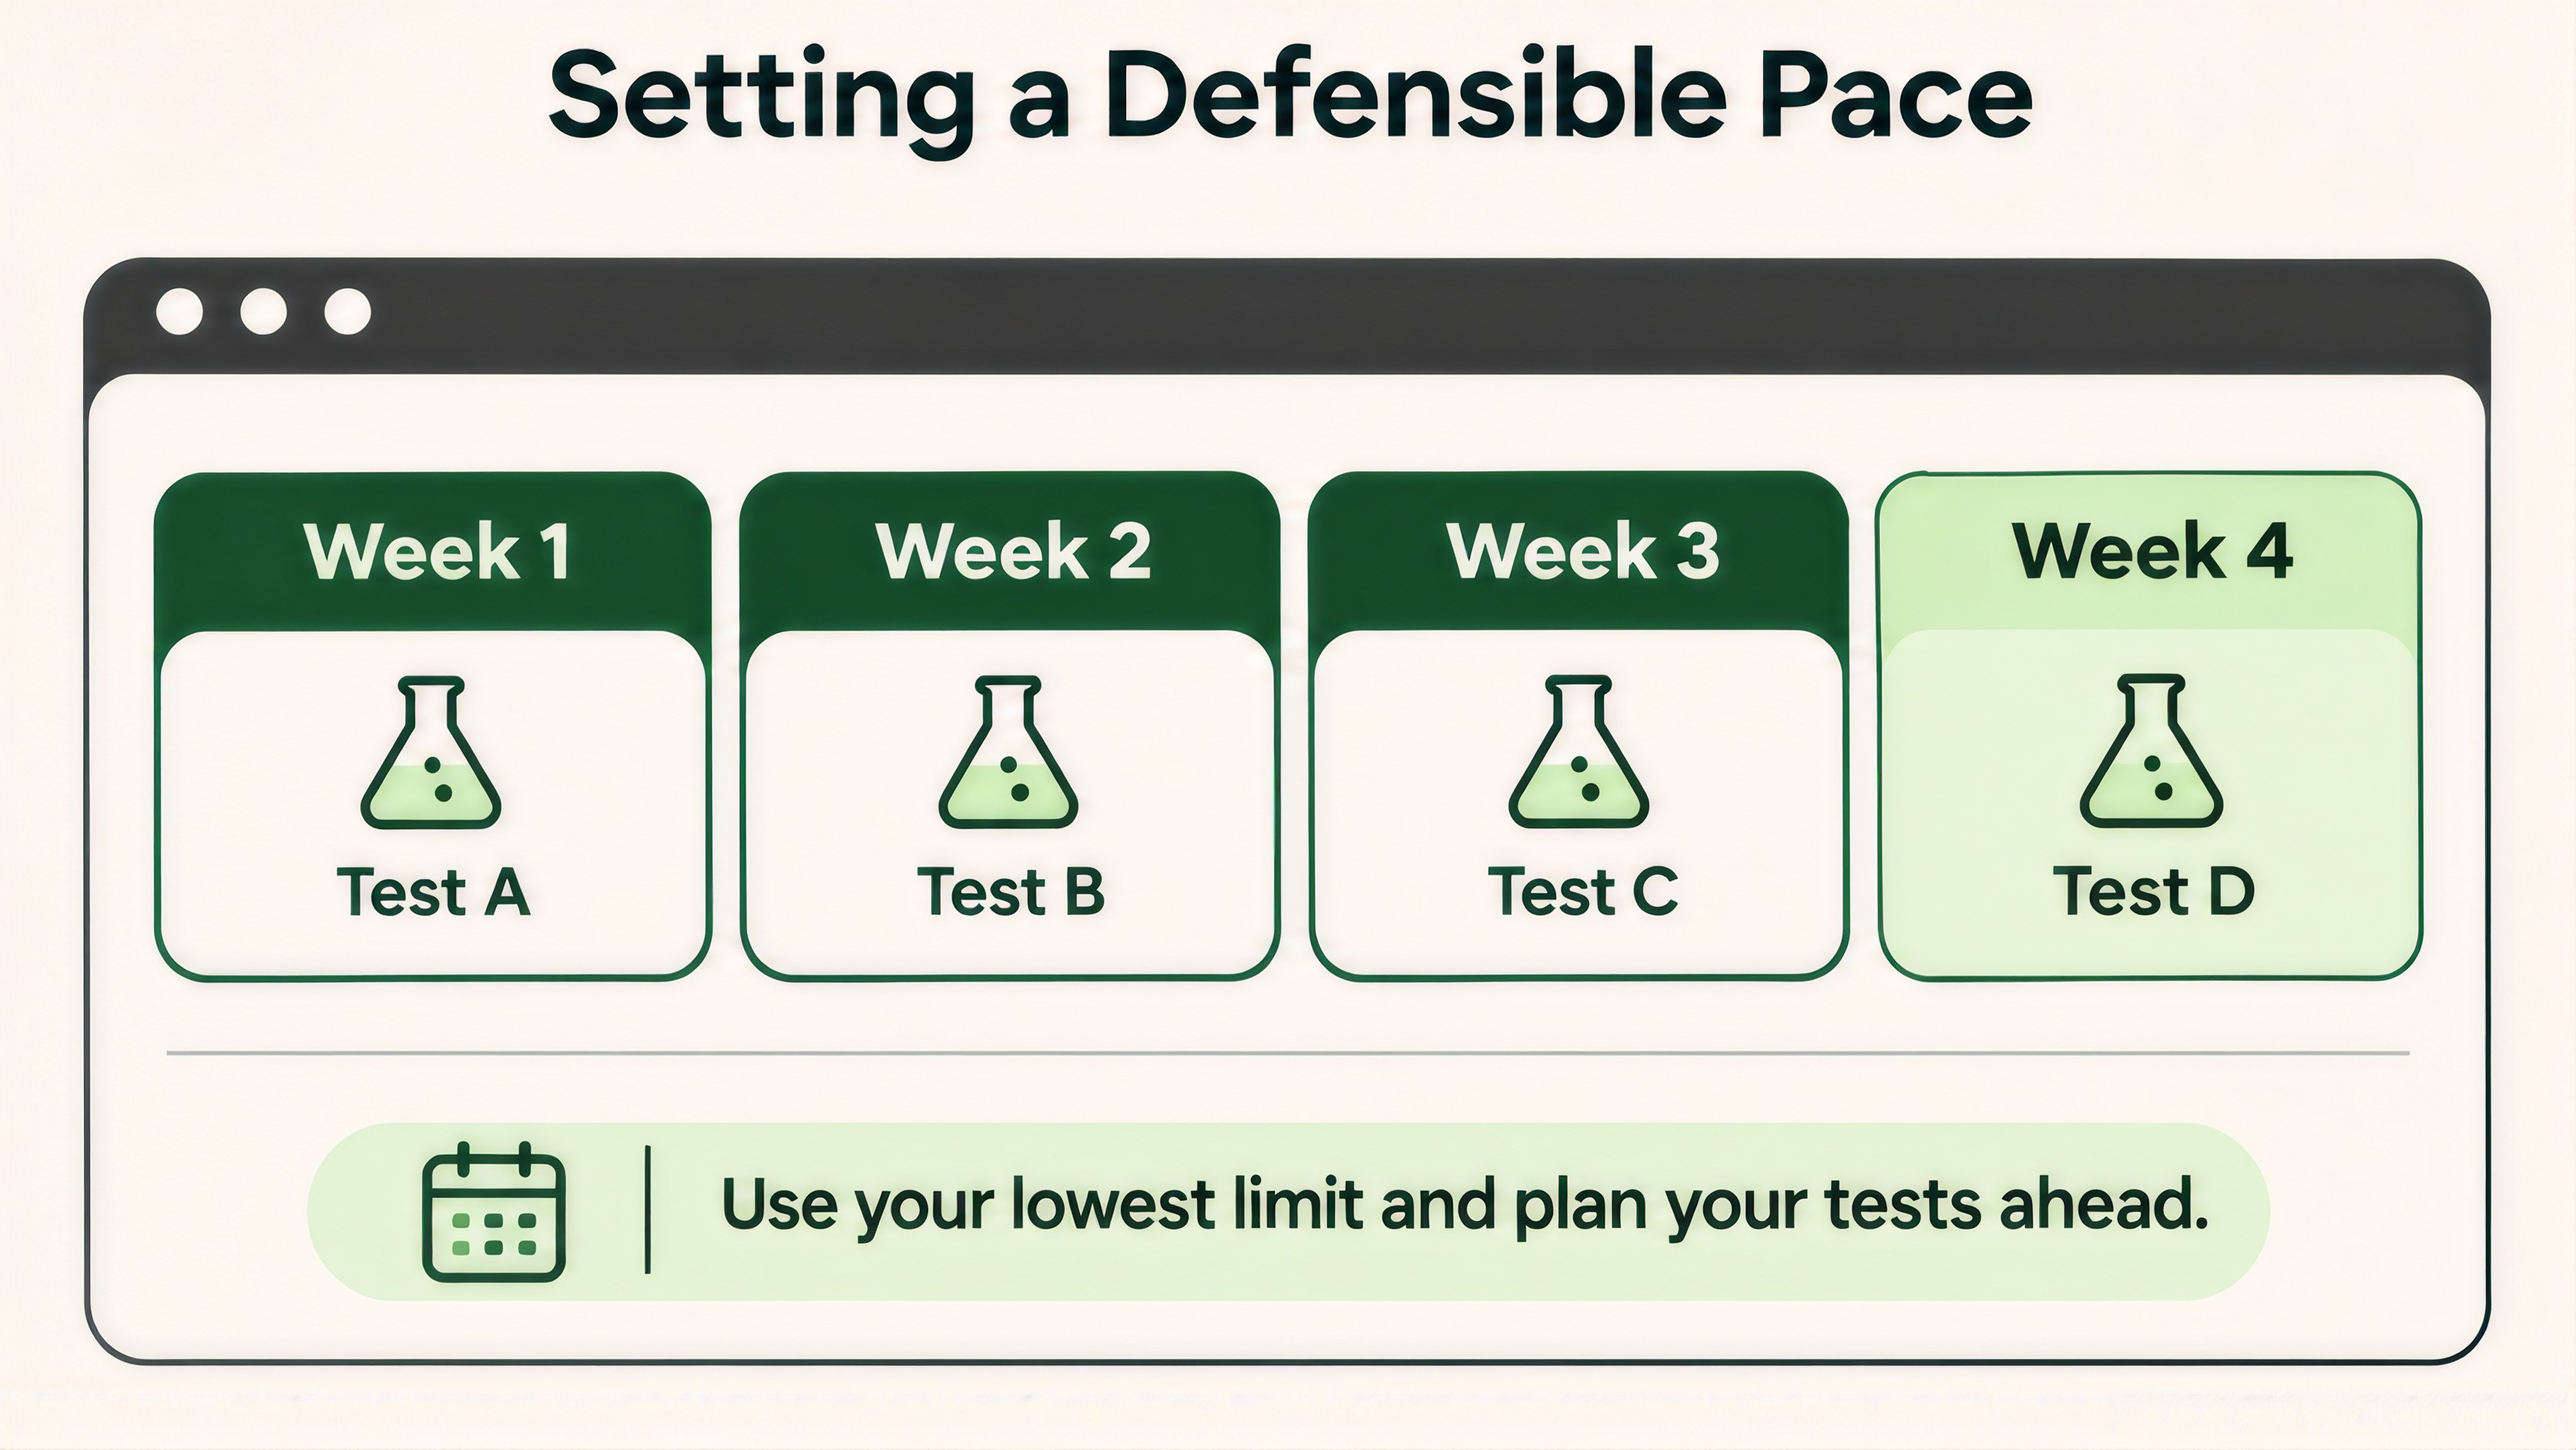
Monetate gives a sample month for a team running 3 to 5 tests. Launch one or two in week one. Monitor and check quality in week two, then analyze and share in week three. Week four is for planning the next round.
Duration is a separate question, and our guide on how long an A/B test should run covers it. For counting valid tests and reading velocity next to other numbers, see our post on CRO program metrics beyond win rate.
If you’d like help working out a realistic pace for your traffic and team, we’ll go through the numbers with you. Talk to our team about your testing program.
Work it out from your traffic and team hours. As a reference point, Monetate’s ranges put early-stage teams at 1 to 2 tests a month while they build the process.
Invesp defines it as how many A/B tests you launch in a given period. We’d count the tests that end in a clear decision.
Usually. Microsoft’s analysis of four major products found interactions to be rare. Keep tests that change the same element apart, and check your results for interactions.
Pace itself doesn’t. What matters is your success rate. The Kohavi, Deng and Vermeer table shows that the lower the share of ideas that actually work, the larger the share of significant wins that are false.