AI Agent vs Chatbot: What’s the Difference for Your Store?
If you’ve been running A/B tests for a year or two, you’ve probably been in a meeting where someone asks why so few tests are winning. The team has put time into planning and running those tests. The data is reliable, but everyone seems focused on one thing: the win rate.
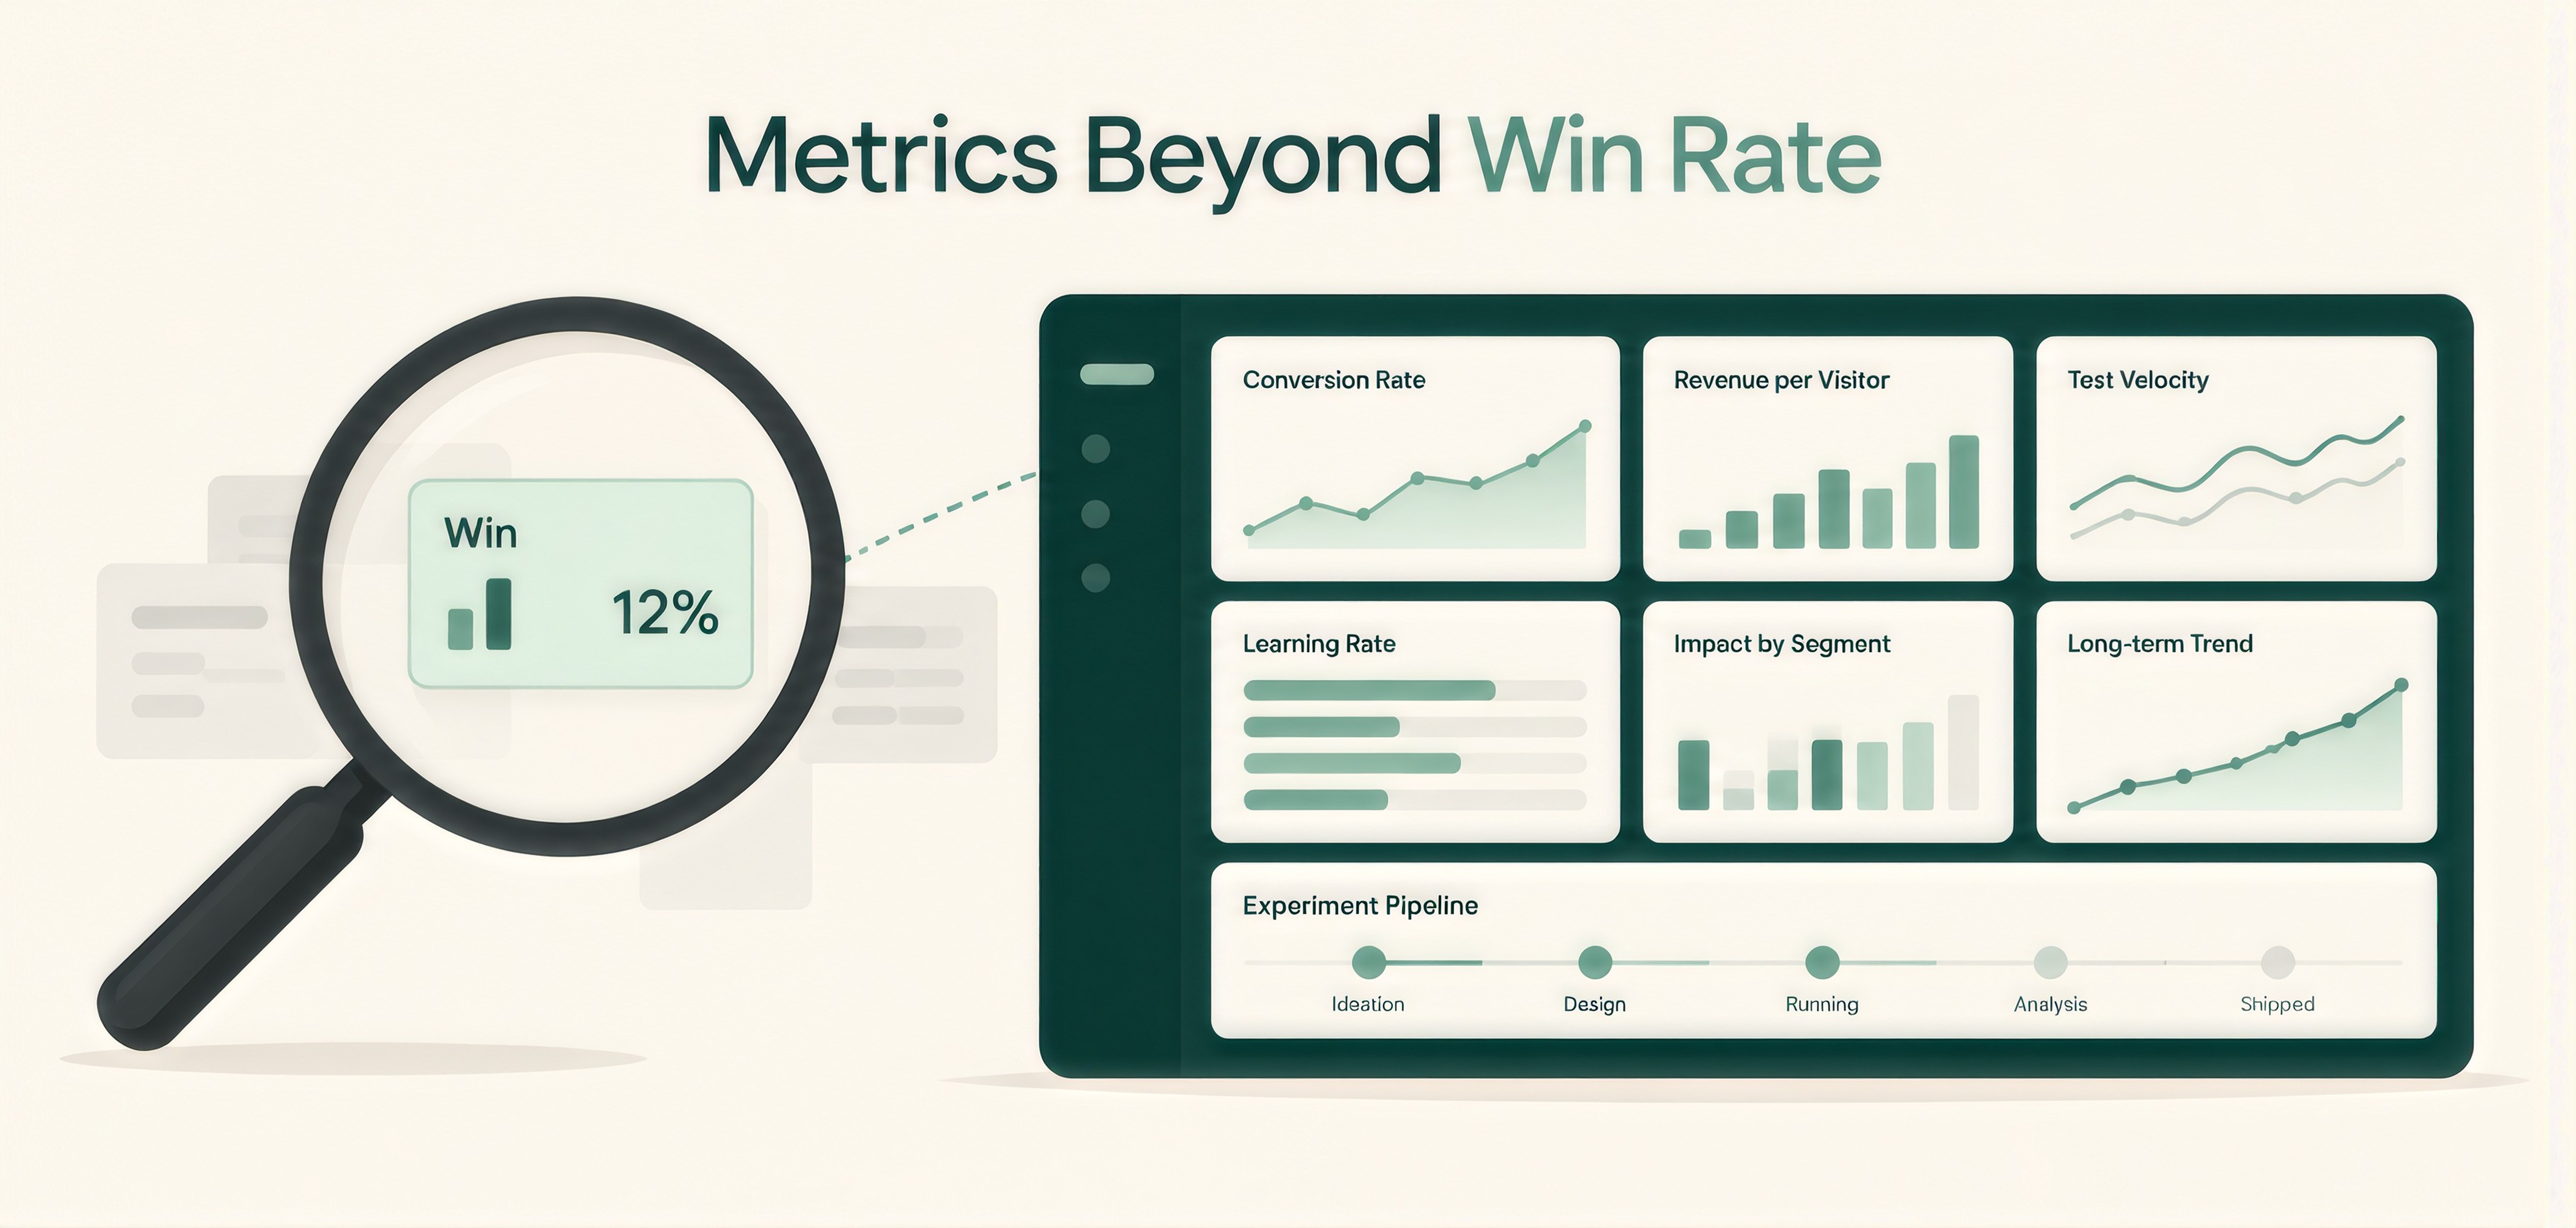
The problem is that win rate alone doesn’t tell you whether your CRO program is doing well. Most teams track conversion rate and win rate. Both are useful, but they only show part of what’s happening. Conversion rate tells you how the website is performing, while win rate tells you how many tests produced a positive result.
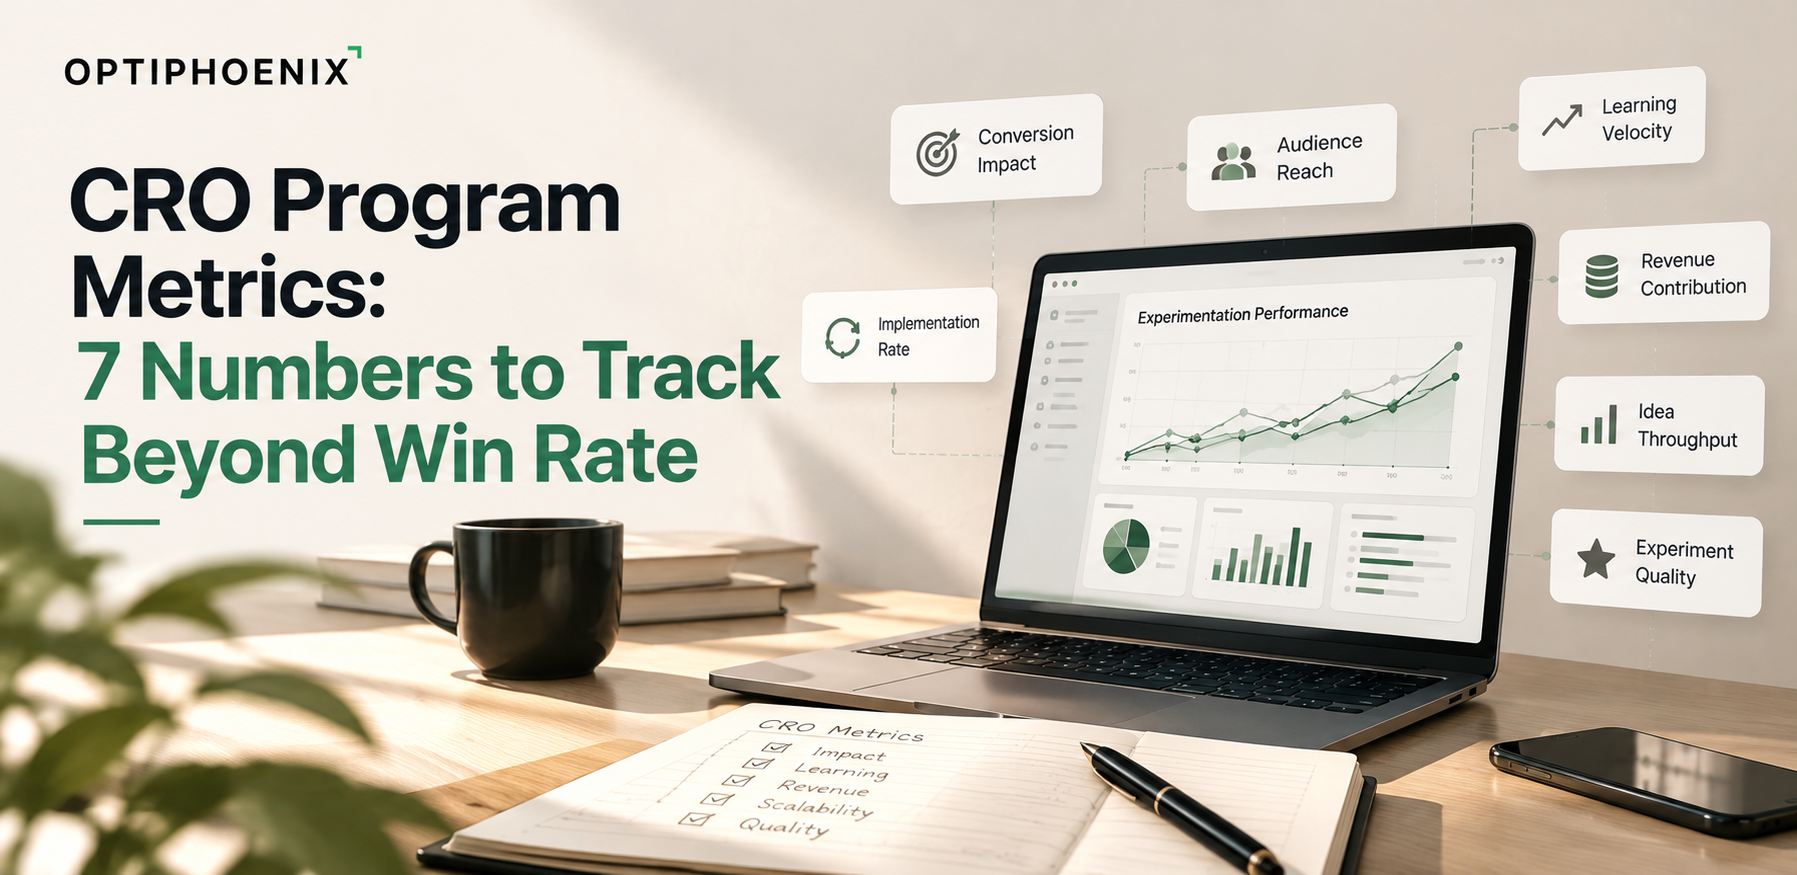
There’s still a lot, these numbers don’t tell you about the testing program itself. In this guide, we’ll look at seven CRO program metrics that can help you understand what’s working, where the program is struggling, and whether your testing efforts are actually making a difference.

Optimizely analyzed 127,000 experiments and found that only 12 percent won. In the same data, 12 percent lost and 76 percent were inconclusive. Most tests, in other words, ended without a win and still told the team something about what to stop spending time on.
Spotify makes a similar point about reporting. In its write-up on the ROI of experimentation, it notes that a report saying 100 experiments ran and 12 won describes an 88 percent failure rate, even though the program may also have prevented harm and produced learning along the way.

Win rate also says nothing about size. Optimizely’s own example compares a program that wins 10 percent of the time and adds a million dollars with one that wins half the time and adds 100 dollars.
SaaS Hero’s CRO agency scorecard cites an audit of 2,288 A/B tests that found a 19.1 percent statistically significant win rate against a raw win rate of 50.5 percent. The page attributes the gap largely to leaving out inconclusive tests, stopping tests opportunistically and using proxy metrics in place of business outcomes. A high win rate deserves a second look for that reason.
CRO program metrics are the measures that show how healthy an experimentation program is, separate from the result of any single test. They cover how many valid tests run, how many end in a decision, how much revenue the changes add, how far the data can be trusted and how quickly findings reach the site
Mason splits CRO measurement into three layers, which are test-level metrics, business impact metrics and program-level metrics for the non-financial side. This guide spends most of its time on the third layer and on how it connects to revenue.

These are the seven measures we suggest adding to your reporting.
Spotify counts an experiment as informative when it leads to a confident ship, hold or iterate decision. It reports a learning rate of about 64 percent, with individual teams ranging from 16 to 76 percent.
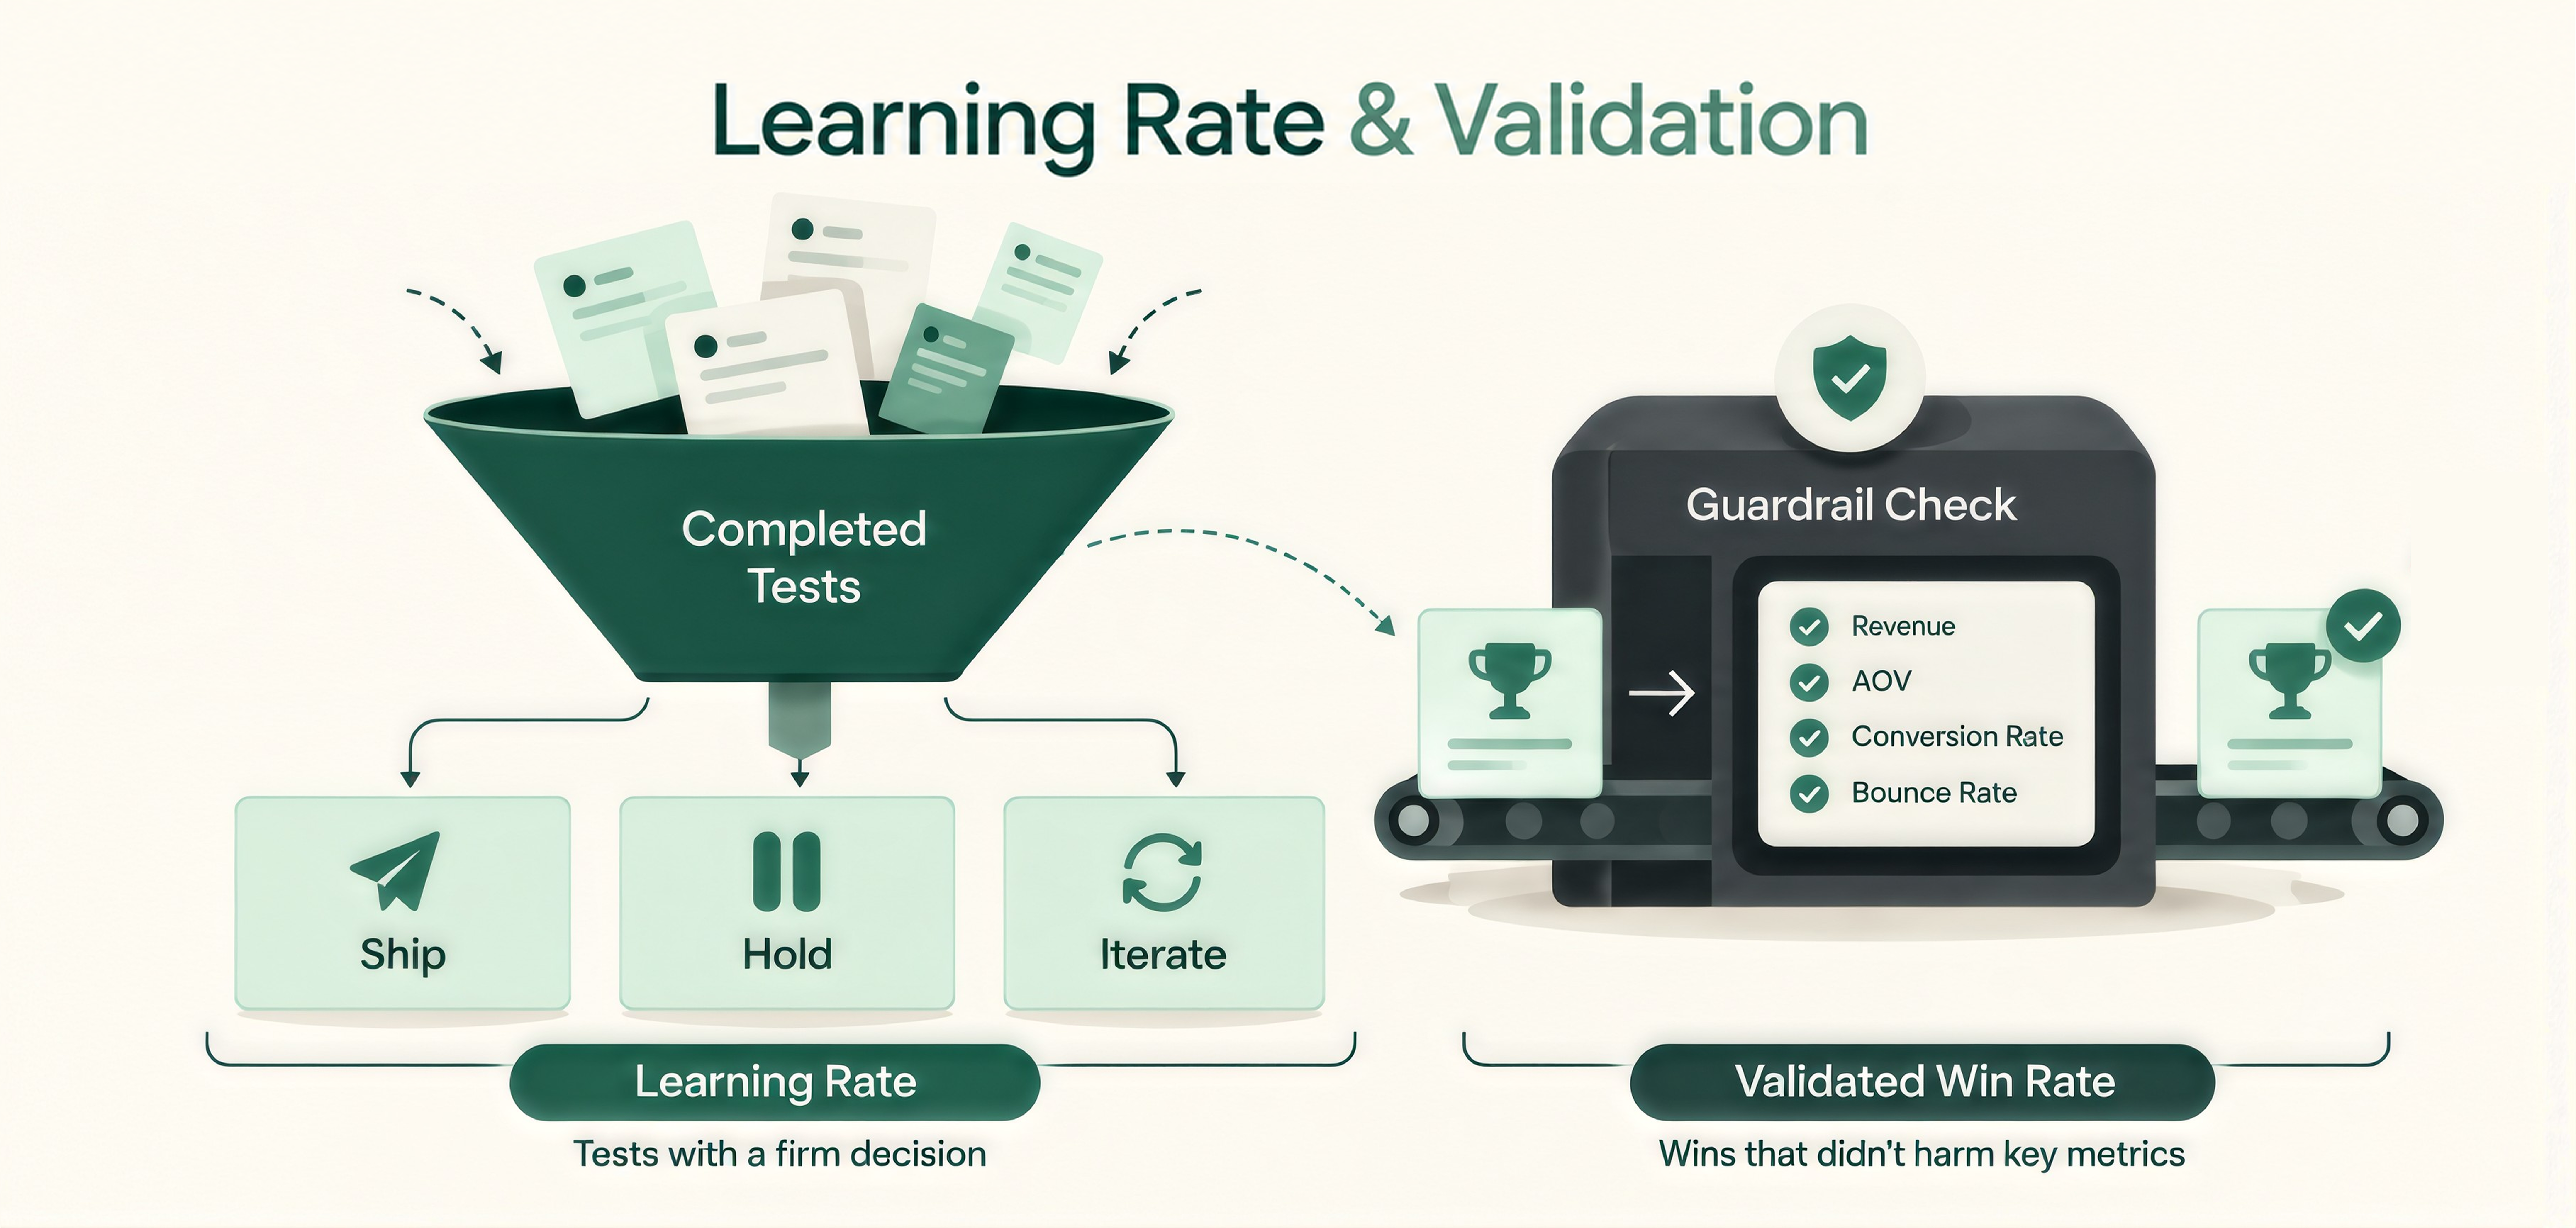
To calculate it, divide the tests that ended in a ship, hold or iterate decision by the tests you completed. A team with a low win rate and a high learning rate has a different problem from a team where both numbers are low.
This is win rate with the loopholes closed. SaaS Hero’s scorecard counts every experiment started in the period in the denominator, including losses and inconclusive tests. A test counts as a win only when the primary metric beat the minimum detectable effect and the guardrail metrics stayed within their limits.
The page gives a B2B SaaS example. A shorter form that raises raw leads but lowers the SQL rate should be rejected, even though the raw win rate would look better. We suggest reporting the validated number next to the raw one so the gap stays visible.
Optimizely found velocity to be the most widely used program metric, and the median company in its data runs 34 tests a year. Counting launches can mislead, though, because a test that never reaches a decision adds little to the program. We suggest counting only valid tests that end in a decision, which separates a busy calendar from a productive one.
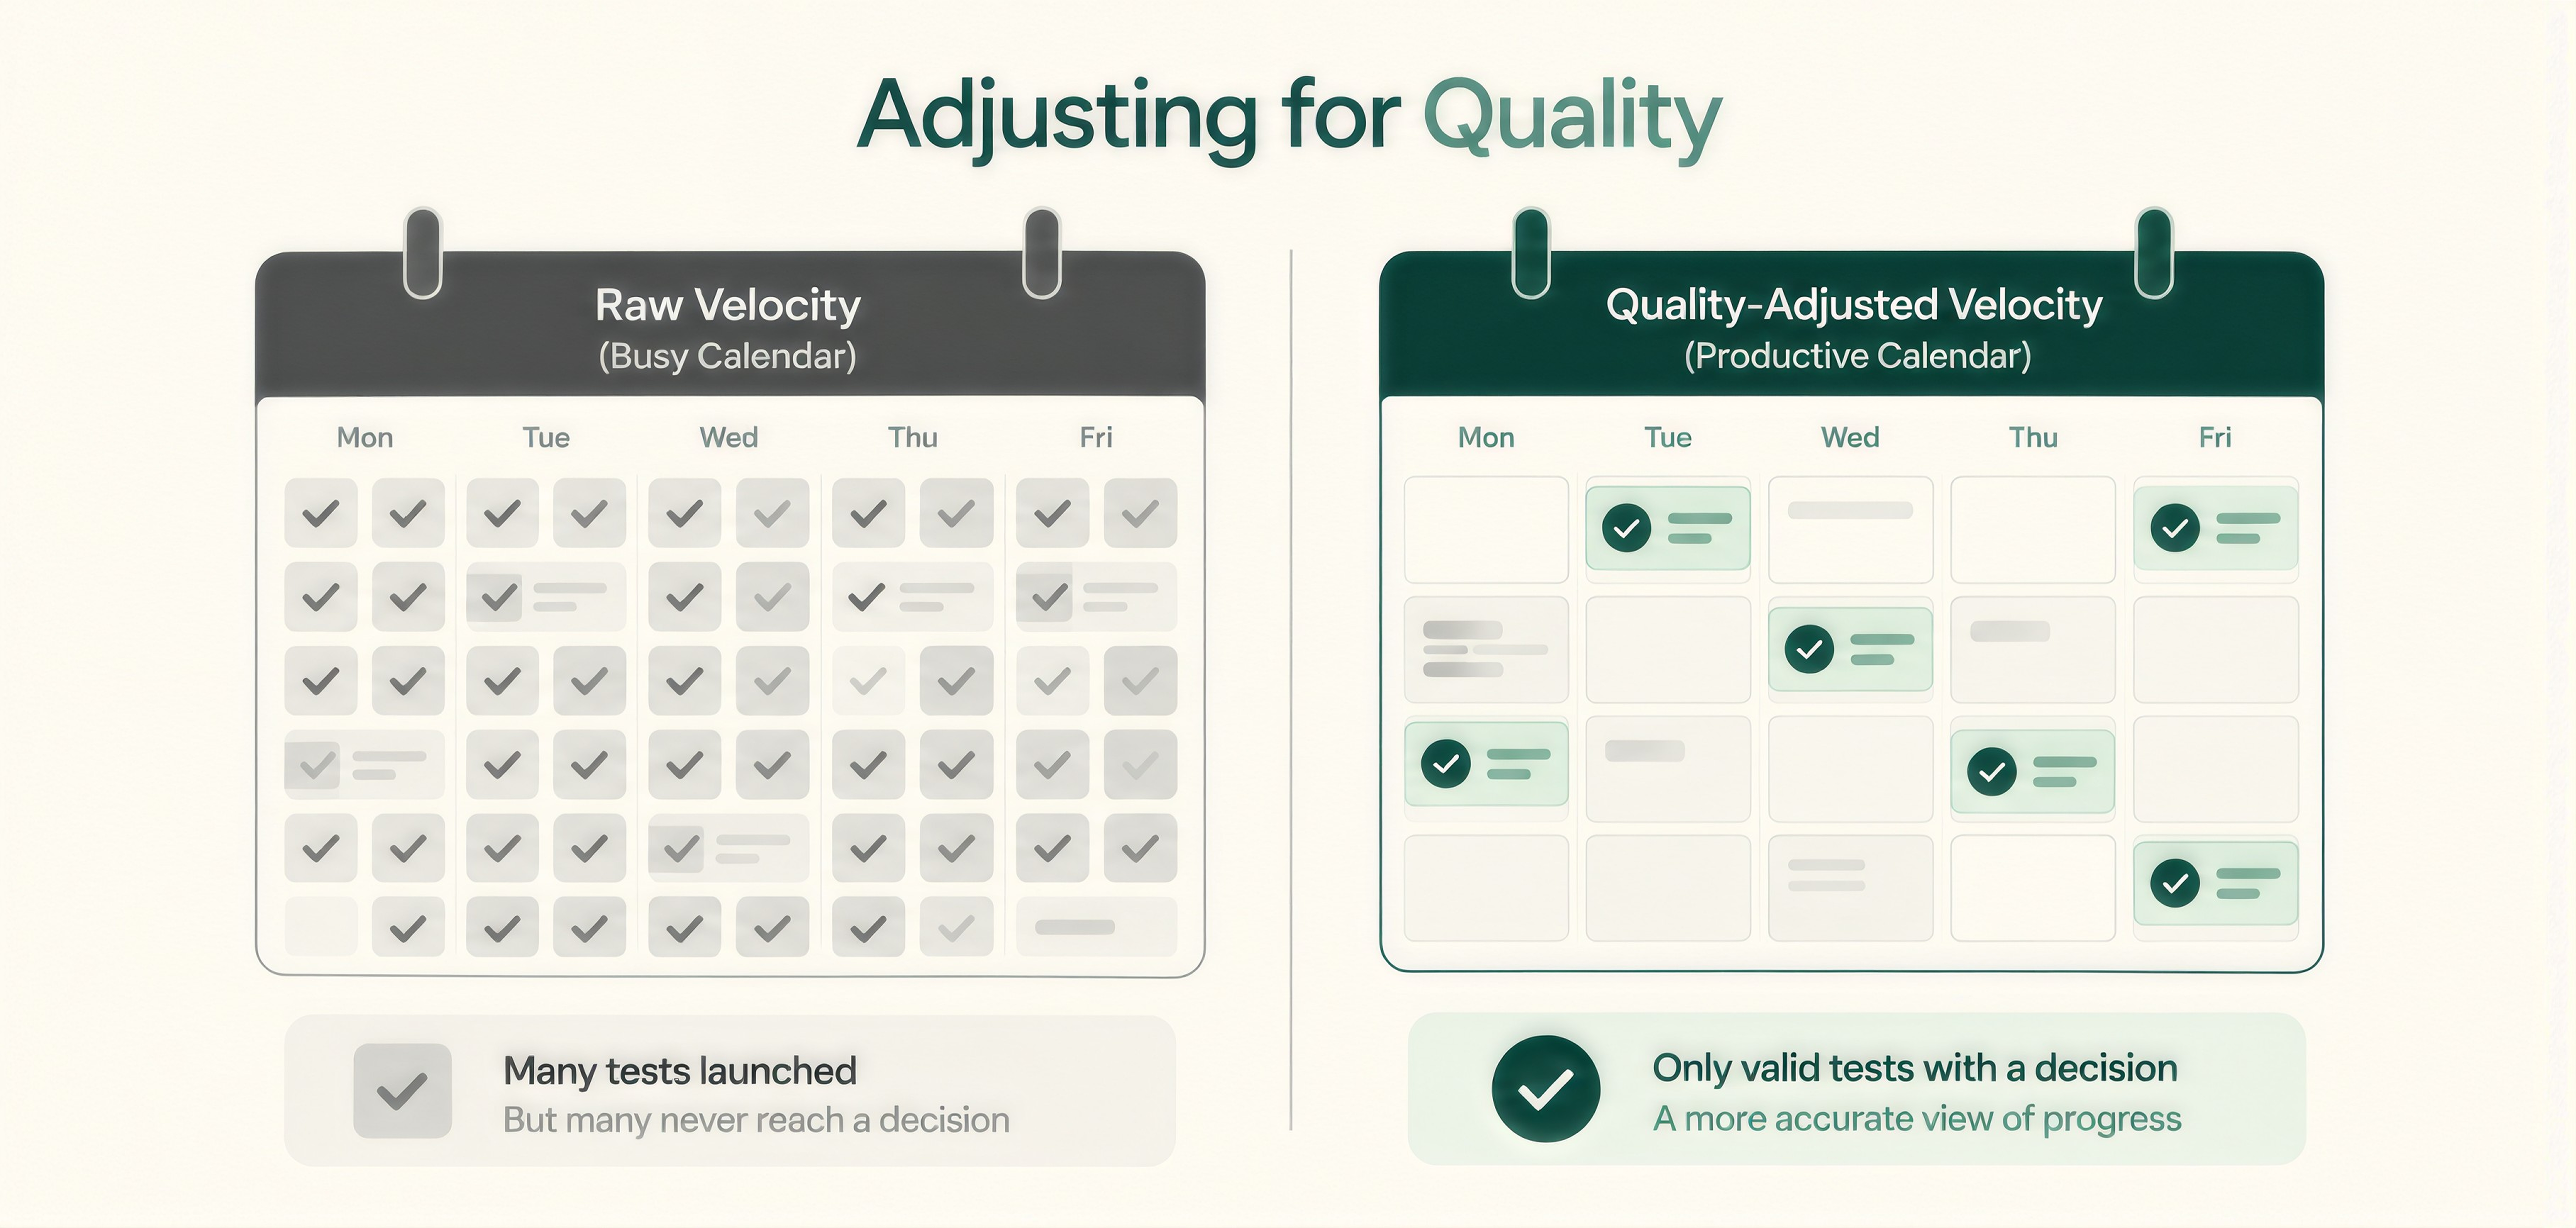
Optimizely also notes that the first 12 to 18 months favor running as many tests as possible, while the highest-uplift experiments in its data made larger changes to the user experience and tested more variations. Read velocity alongside the size of the changes you are testing.
Revenue from winning tests is the number executives ask for most often. Mason points out that it leaves out the risk side, and recommends also showing the revenue loss the program prevented. Spotify points to rollback rate as a sign of how much harm the program prevented.
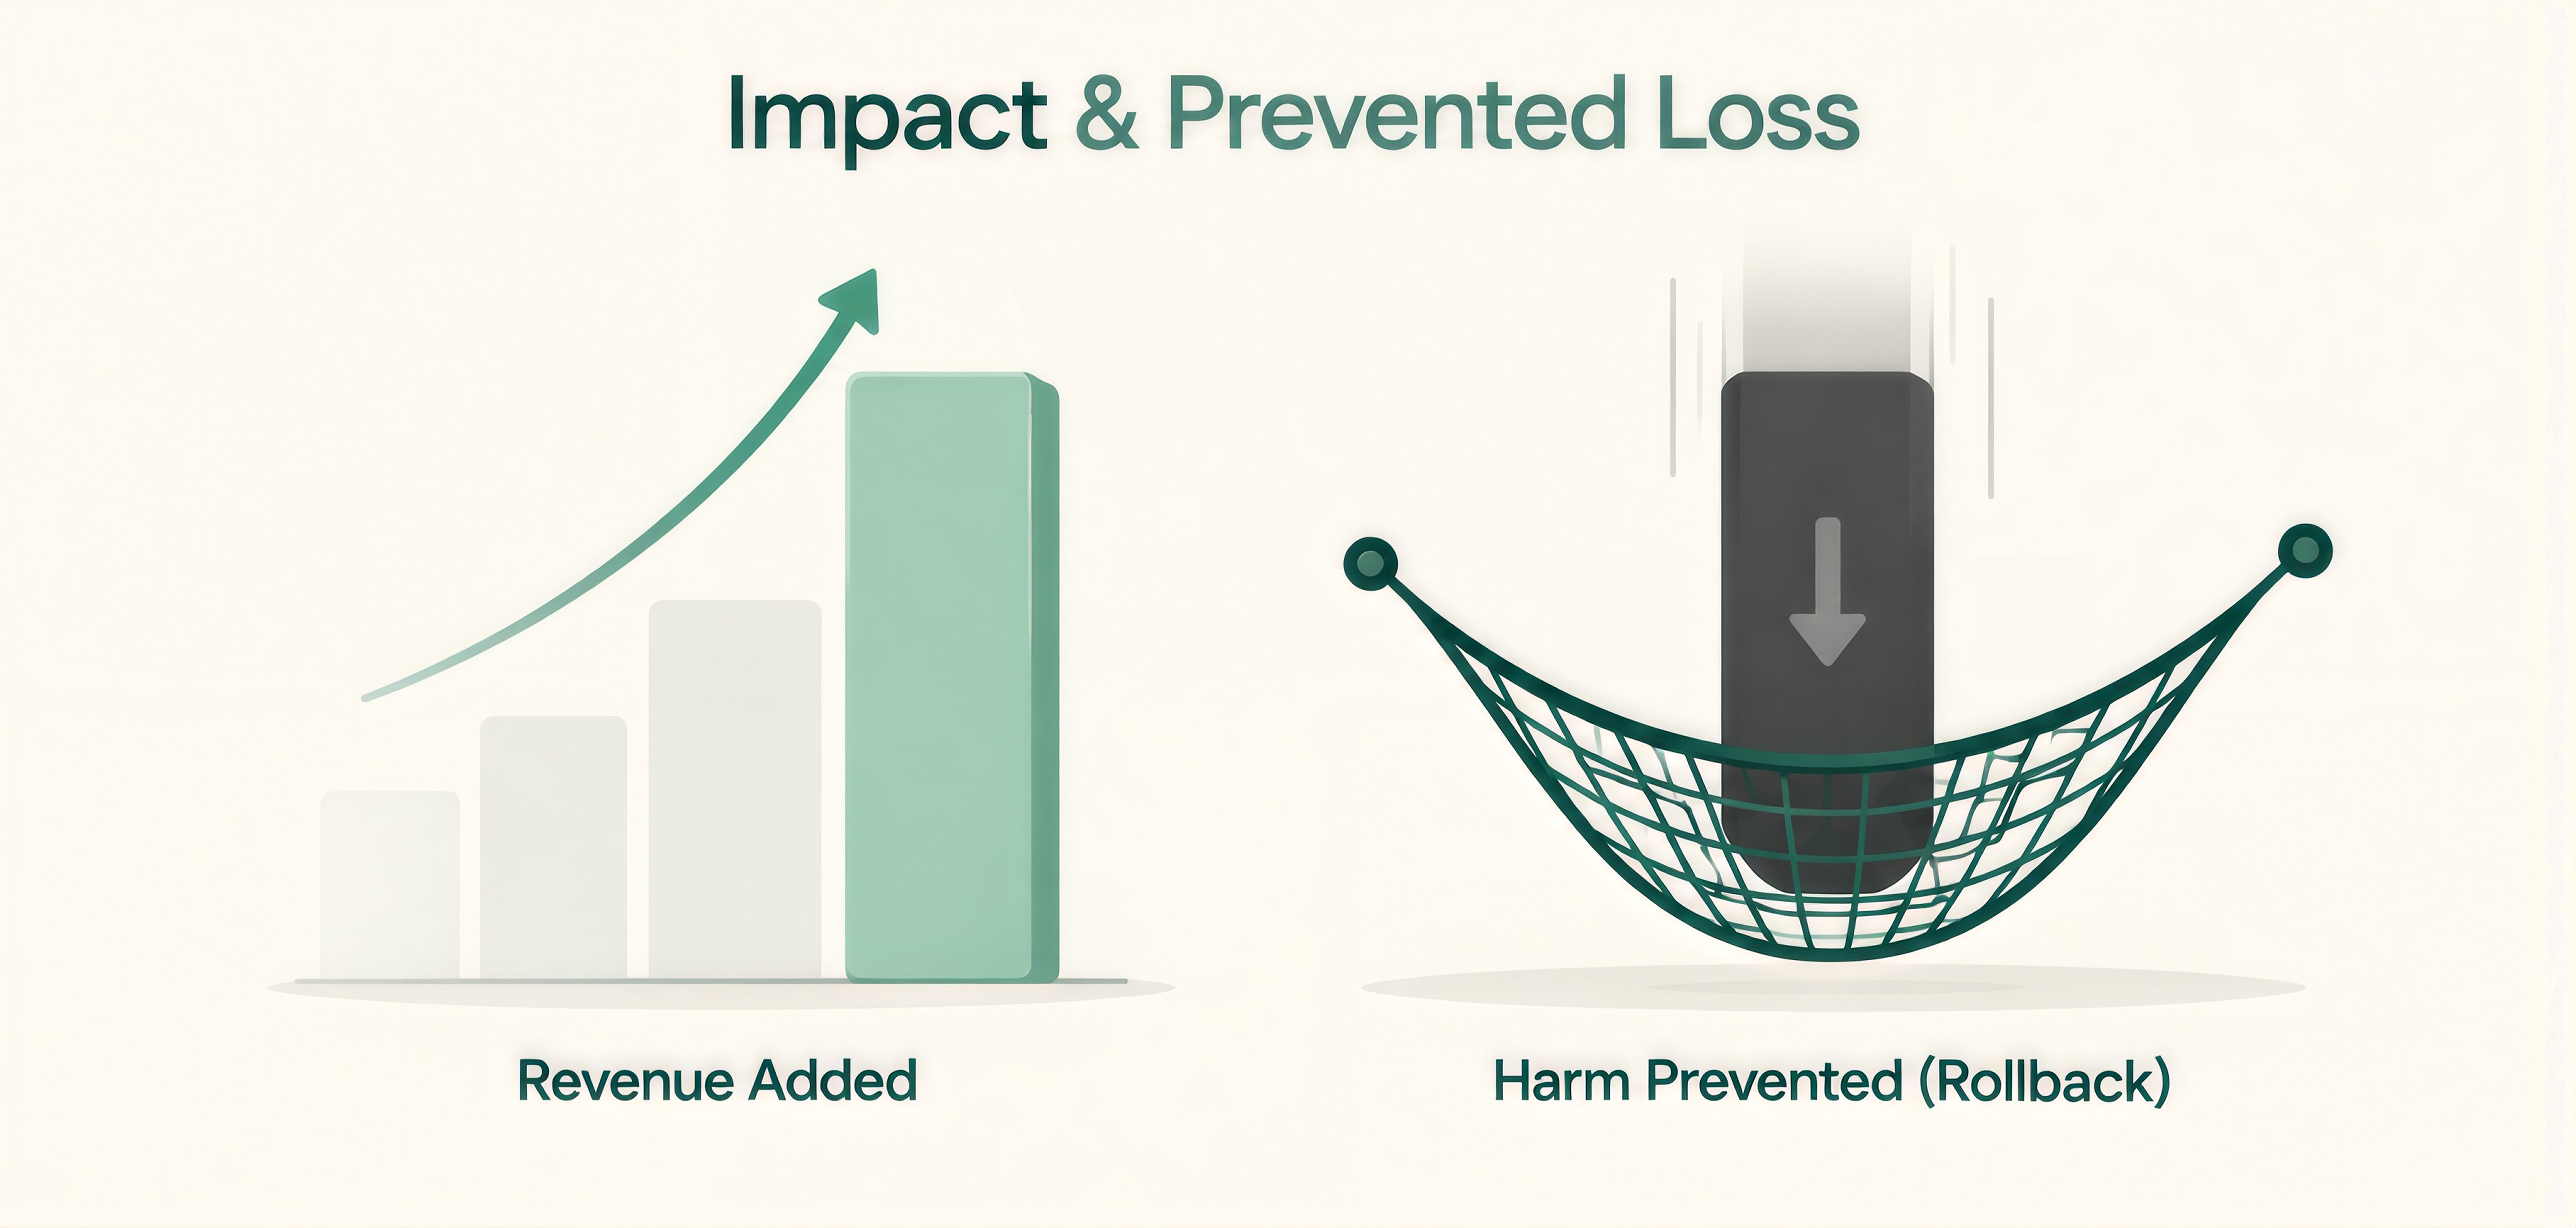
When revenue is hard to attribute, Optimizely suggests measuring as low in the funnel as you can. Mason mentions lead-to-opportunity rate and lead-to-close rate as examples for lead generation sites.
A win built on bad data is a risk, so it helps to track how often that happens. Speero’s taxonomy includes an issue rate, which covers experiments with production problems, and an error rate, the share of experiments that end with bad data.
We cover the usual causes in our posts on consent, cookies and sample ratio mismatch and on why A/B tests keep failing. If this number is high, we would fix tracking before adding more tests. That is the work our Analytics Infrastructure service handles across GA4, Looker Studio and Adobe.
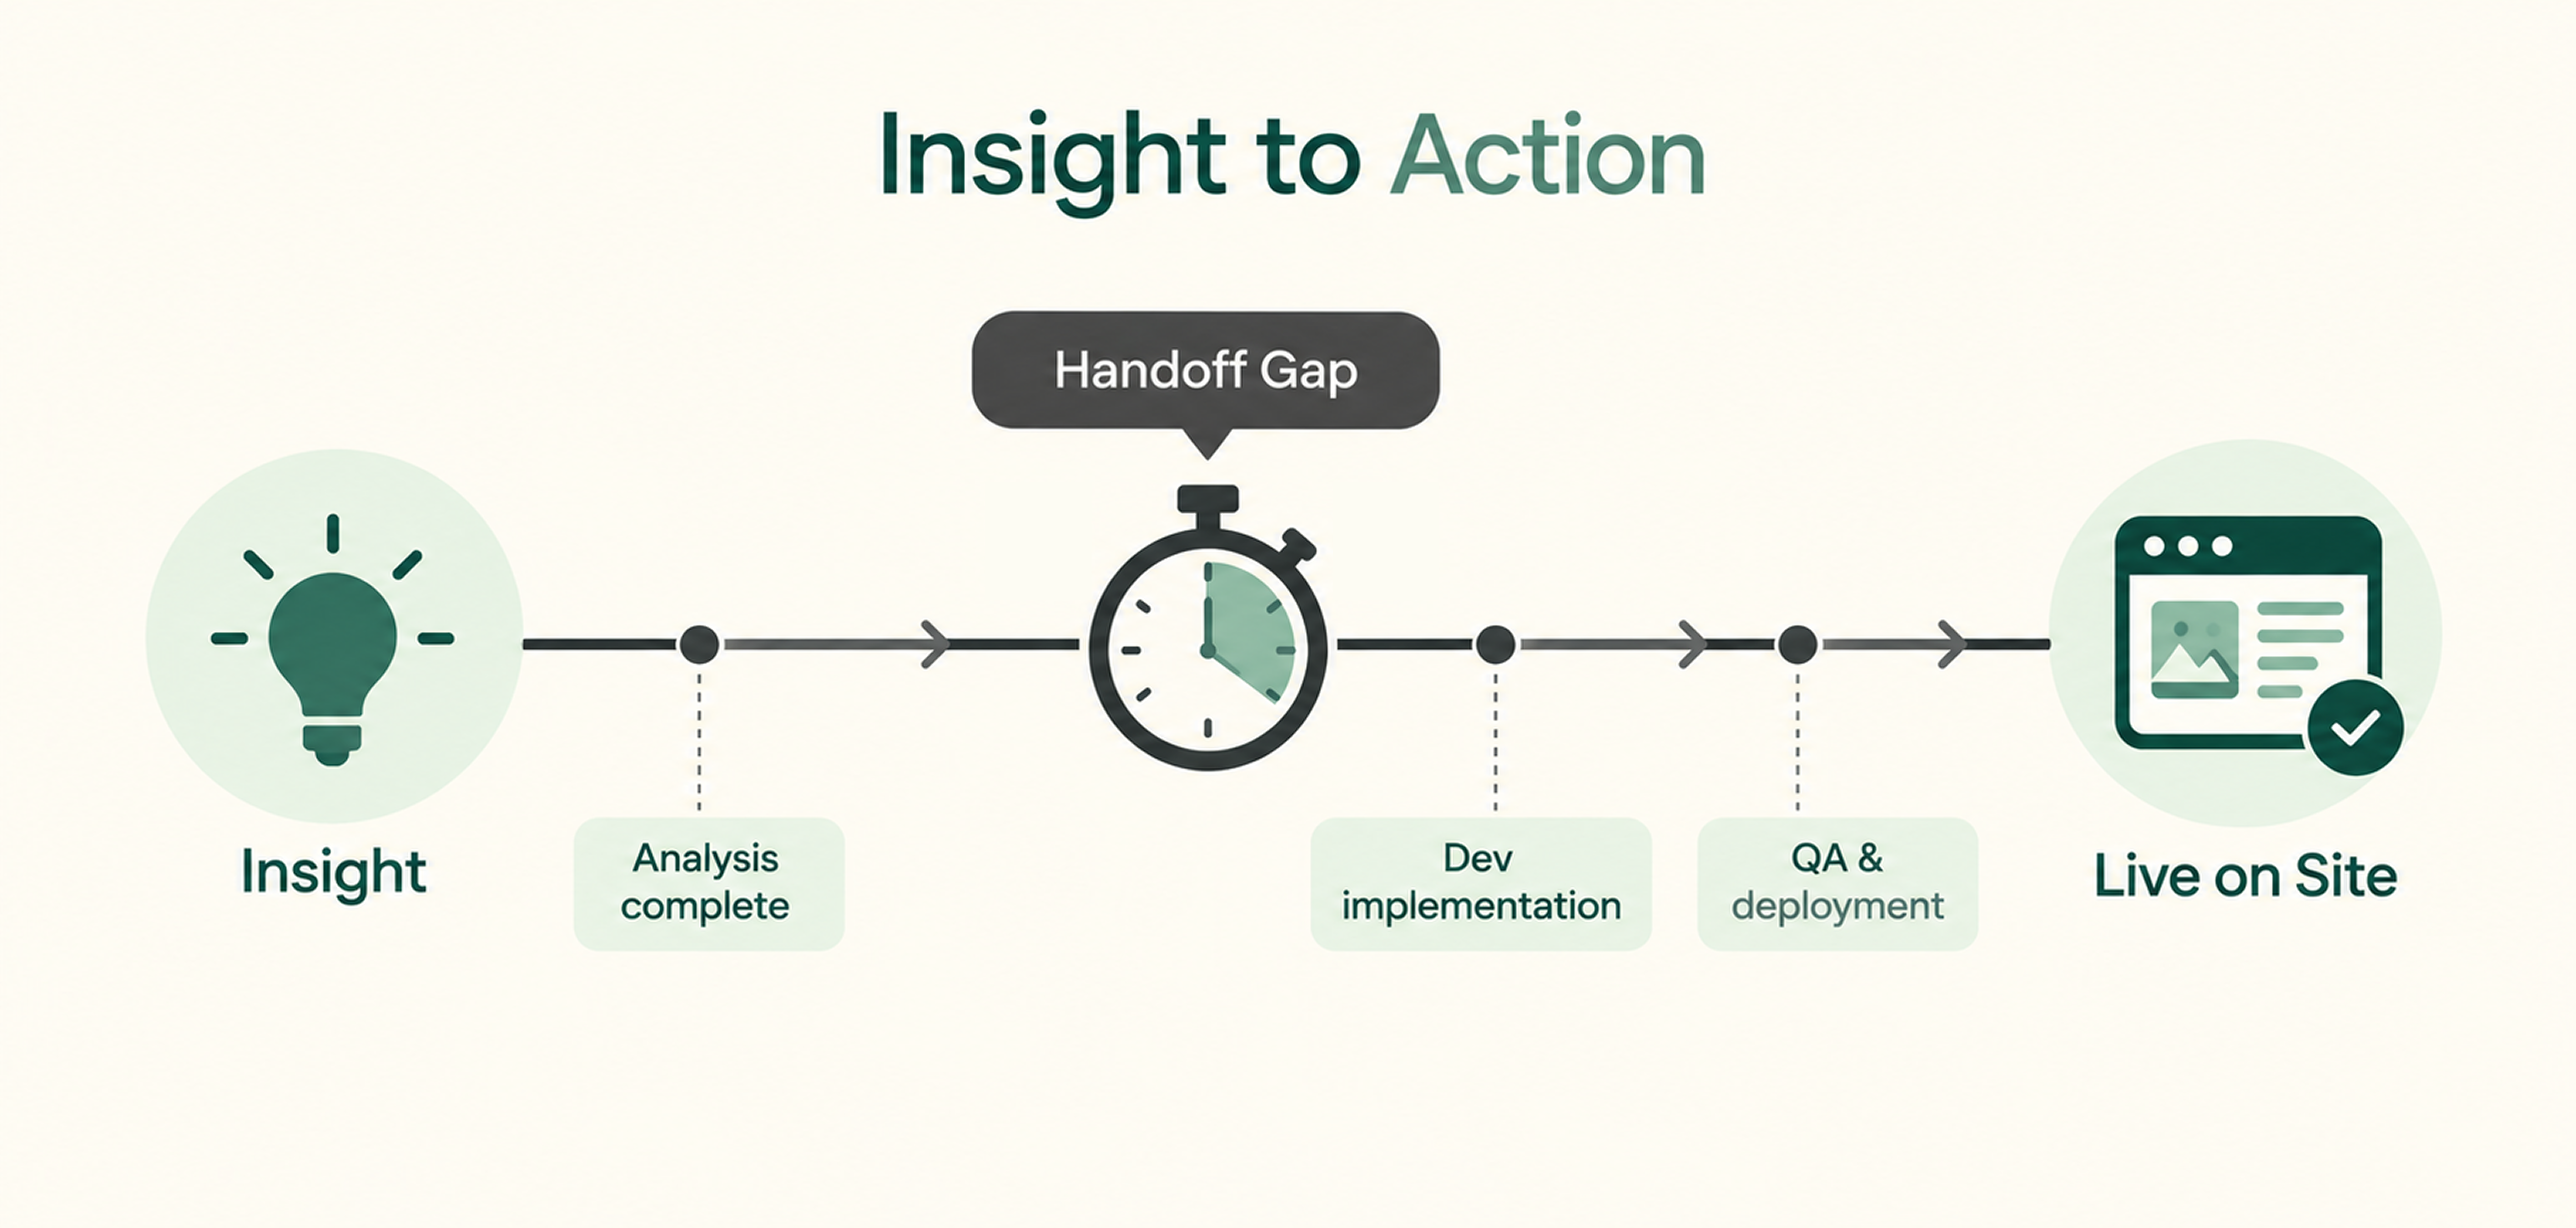
Speero lists the number of days from an insight to action as a program metric. A finished test only changes revenue once the winning version is live, which is why we like this one. When the number grows, the first place we look is the handoff between analysis and development, and dedicated A/B developers and QA testers can shorten that gap when capacity is the cause.
This one comes from our own practice and has no published benchmark that we have found. We suggest tracking the share of new test hypotheses that reference a previous result, because it shows whether past tests are shaping future ones. It follows the idea behind the Business Brain model on our homepage, where validated paths get strengthened and weak ones get dropped.
A shared library of tests and results makes the number easy to calculate, and building one is part of our Centre of Excellence work. Treat it as a trend line against your own history.
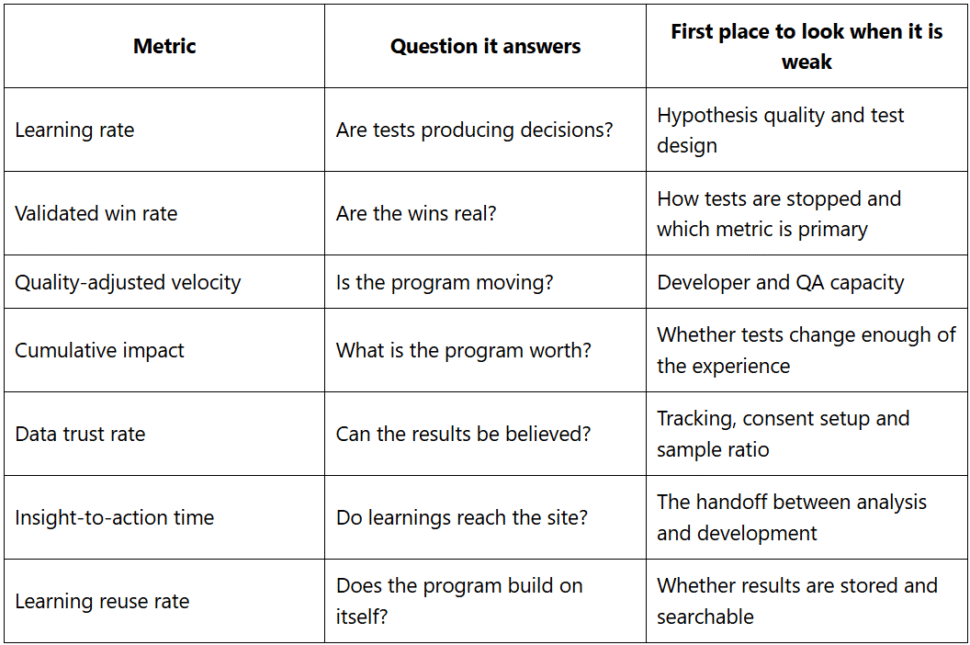
No single number tells you whether a program is working. The table pairs each metric with the question it answers and the place we would look first when it is weak.
You do not need new software to begin. A spreadsheet is enough for the first pass.
If you are still deciding where to begin, our post on what to test first after a CRO audit is a useful companion.
Optimizely’s dataset of 127,000 experiments shows 12 percent winning, while Speero describes 20 to 30 percent as enough. Because the sources define the number differently, compare your validated win rate with your own history first.
Optimizely’s data shows the median company runs 34 tests a year. Optimizely suggests running as many tests as practical during the first 12 to 18 months of a program, then putting more effort into larger changes and more variations.
Mason recommends measuring at three levels, which are the results of each test, the business impact across all tests and the program-level measures covered above. It also suggests reporting the revenue loss the program prevented, along with downstream measures such as lead-to-opportunity rate for lead generation sites.
Learning rate is the share of experiments that produce enough valid information to support a decision. Spotify reports a rate of about 64 percent across its teams.
The seven measures above show whether the testing behind your site numbers is healthy. Mason also points to downstream measures such as lead-to-opportunity rate and lead-to-close rate, which show the quality of conversions and not only the count.