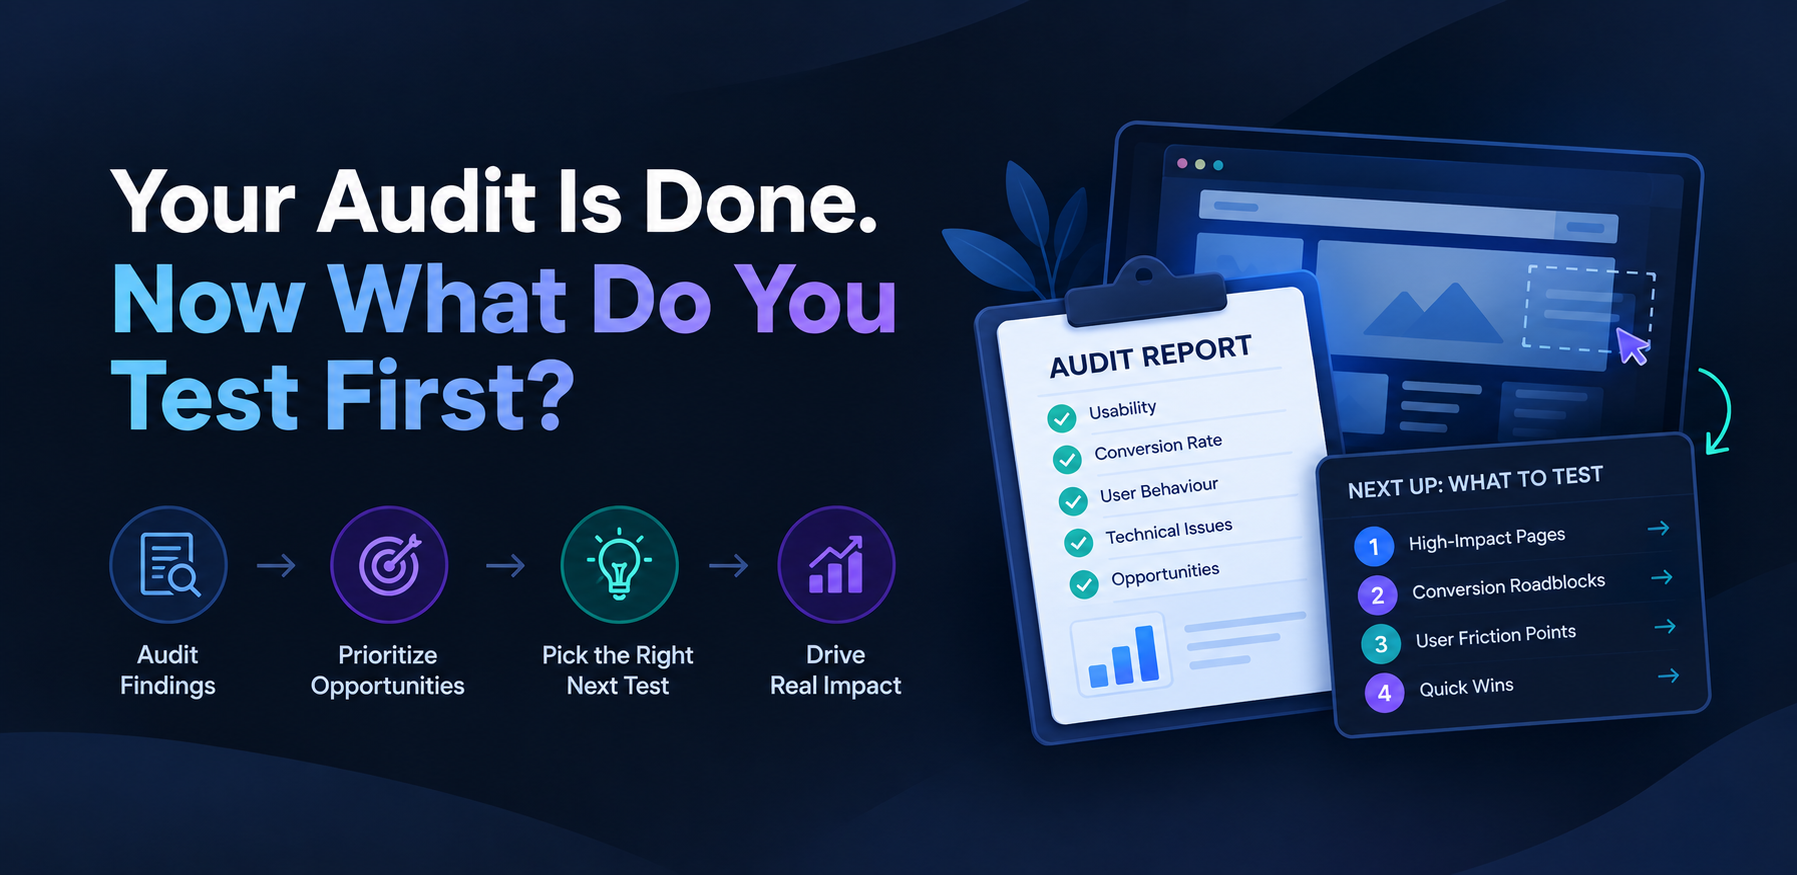
Your Audit Is Done. Now What Do You Test First?
Traffic is not the problem for most websites. Conversion is.
Most teams already suspect something is broken. They just don’t know where to look first. A conversion rate audit gives you that answer: a specific, evidence based picture of where your funnel is leaking and what it will take to fix it.
You run ads. Publish content. Track rankings. Visitors arrive. And then they leave, without filling out the form, without completing the purchase, without taking the action you built the page for. The numbers tell you something is wrong. They rarely tell you what, or where, or why.
That is what a conversion rate audit is designed to fix.
This guide walks through what a CRO audit actually covers, how to run one and what to do with the findings. The goal is not a checklist you complete once. The goal is a clear picture of where your funnel is failing and a prioritized plan to fix it.
A conversion rate audit is a structured review of your website’s performance across the full customer journey. It uses quantitative data, which includes analytics, funnel drop off rates and page level metrics, alongside qualitative data such as session recordings, heatmaps and user feedback to identify where and why visitors are not converting.
The output is not a generic list of best practices. It is a diagnosis specific to your site, your audience and your current funnel. You end up with a prioritized list of friction points, ranked by their likely impact on conversion.
According to Baymard Institute research, addressing documented checkout usability issues alone can increase conversion rates by up to 35.26% on an average ecommerce site. The same research found the average site has 39 potential areas for checkout improvements. (Source: Baymard Institute)
Most of those 39 issues exist because nobody looked for them systematically. That is the gap a conversion rate audit closes.
There is no single trigger that makes an audit necessary. There are several and you do not need to wait for a crisis to act.
Run an audit when:
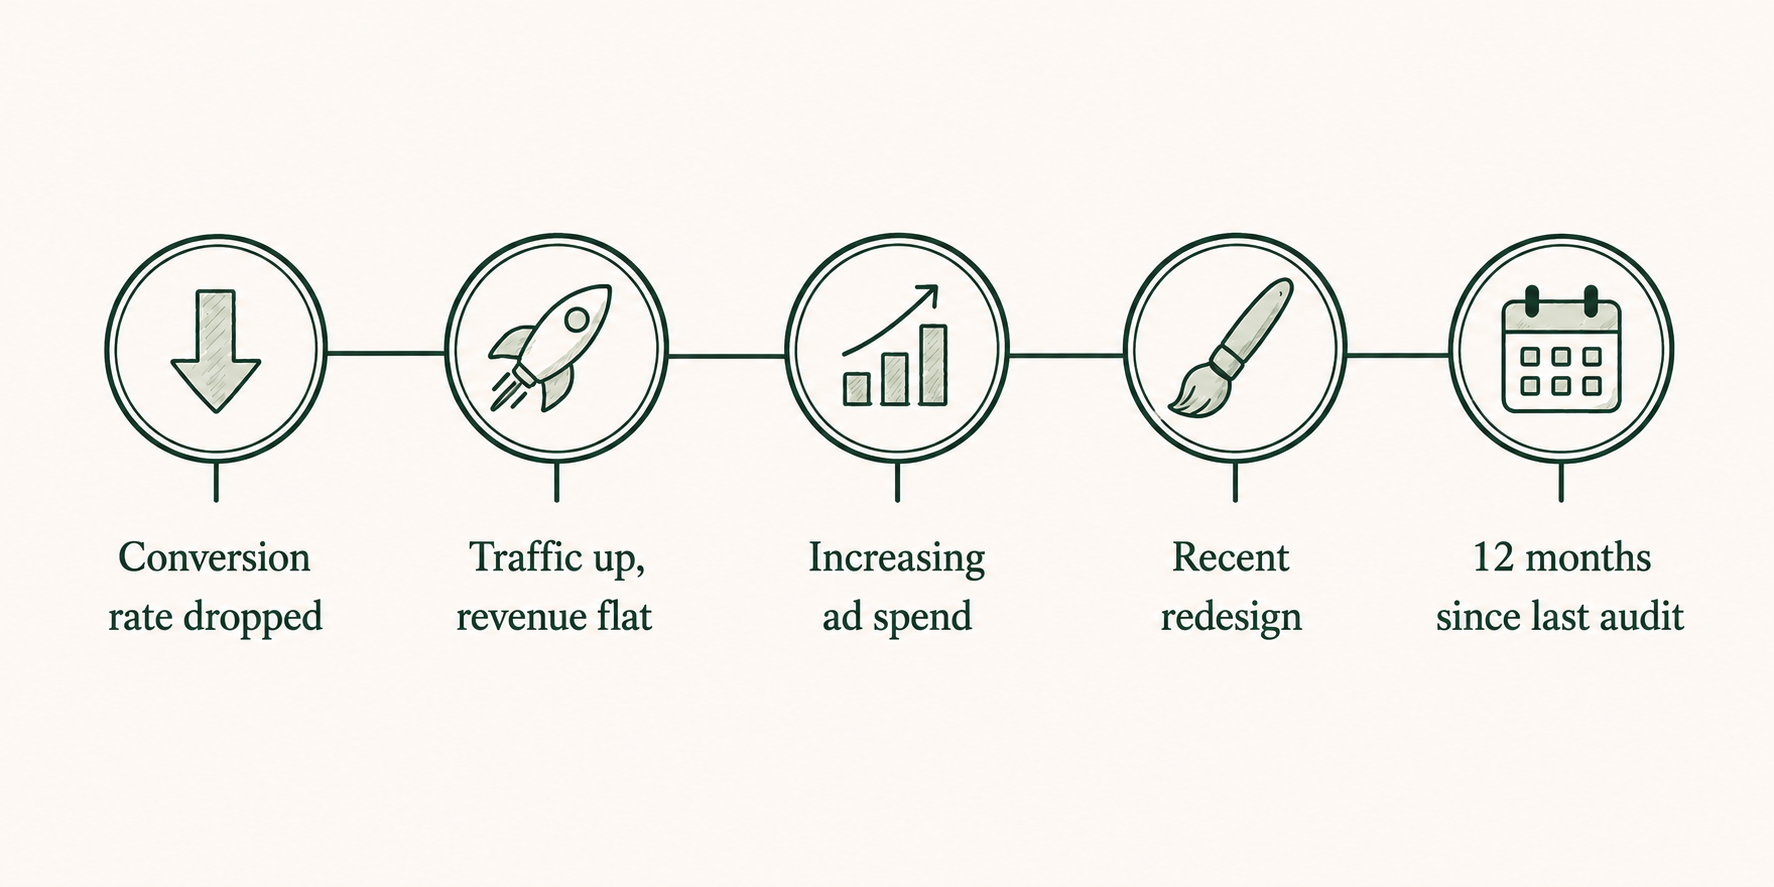
That cadence is reasonable for high-traffic, high-transaction sites. For others, a thorough audit once or twice a year, combined with ongoing monitoring, is a workable baseline.
Most conversion problems do not live where teams expect them to. The issue is rarely the homepage. It is usually a step further in, at a point where intent is high and trust has not yet been established. A conversion rate audit examines every layer of the funnel because the gap between where visitors drop off and where teams think they drop off is almost always significant.
This is the starting point. Where are visitors entering? Where are they exciting? Which steps in the funnel have the highest drop-off rate? Analytics data gives you the what before you look for the why. Key metrics examined include: bounce rate, exit rate by page, funnel step completion rates, session duration, pages per session, and conversion rate by traffic source and device.
Quantitative data tells you where drop-off happens. User behaviour analysis tells you what visitors are actually doing on each page. This includes heatmap analysis showing where users click, tap, and scroll, session recordings capturing how individual users navigate and where they hesitate, and on-page engagement signals like rage clicks or dead clicks. For more on visitor behavior analytics methods, see our dedicated guide.
Each key landing page is evaluated against the visitor’s intent at that point in the funnel. Common issues found here include: headline and message mismatch with the ad or link that brought the visitor, value proposition that is unclear or buried, call-to-action placement or wording that creates confusion, and page load speed.
A 1-second delay in page load time can reduce conversions by up to 7%. (Source: Invesp)
For ecommerce and lead generation sites, the checkout and form sequence often contains the most recoverable conversion loss.
As of October 2024, the average cart abandonment rate across all ecommerce industries is 74.09%. (Source: Oberlo / Dynamic Yield)
Baymard Institute’s checkout research shows the average site has 23.48 form fields by default. The recommended target is 12 to 14. That gap creates measurable conversion loss on almost every site that has not been specifically optimised.
Key issues examined in this layer include: number of steps and form fields, guest checkout availability, trust signals and payment options, error message clarity, and mobile checkout experience.
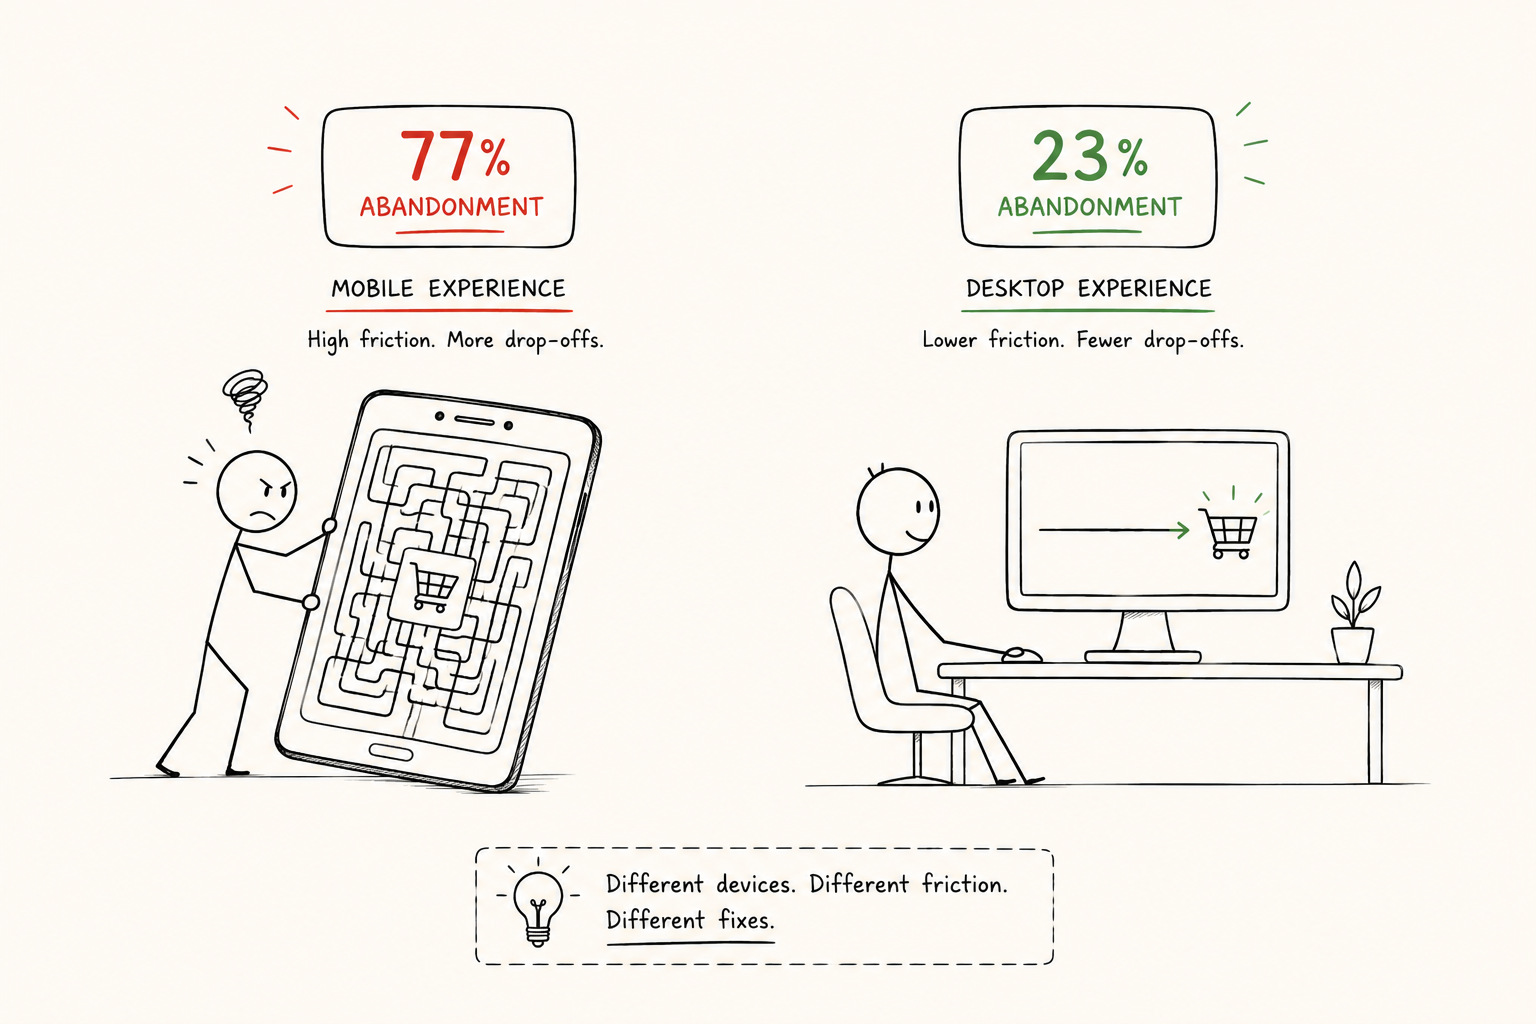
Mobile cart abandonment runs significantly higher than desktop. In Q3 2024, desktop users abandoned at approximately 66.39%, compared to 77.06% on mobile. (Source: Oberlo)
A conversion audit assesses mobile experience separately from desktop. The friction points are different. The fixes are different. Treating them as the same is one of the most common audit gaps.
Visitors who do not trust a site do not convert. An audit reviews the placement and effectiveness of trust signals across key pages: testimonials, security badges, review counts, return policies, and brand credibility indicators.
Before touching any tool, document your current state. What is your overall conversion rate? Your micro-conversion rates at each funnel stage? Bounce rate on key pages? What is your cart abandonment rate?
Without a documented baseline, you cannot measure whether the changes made after the audit actually worked. This step is often skipped. Skipping it makes every subsequent improvement harder to attribute.
Conversion data is only as accurate as the tracking behind it. Before analyzing results, confirm that goals are set up correctly, that funnel steps are tracked, that events fire as intended, and that there are no significant data discrepancies.
Broken or misconfigured analytics is more common than most teams expect. An audit of the tracking layer is always part of a rigorous CRO audit.
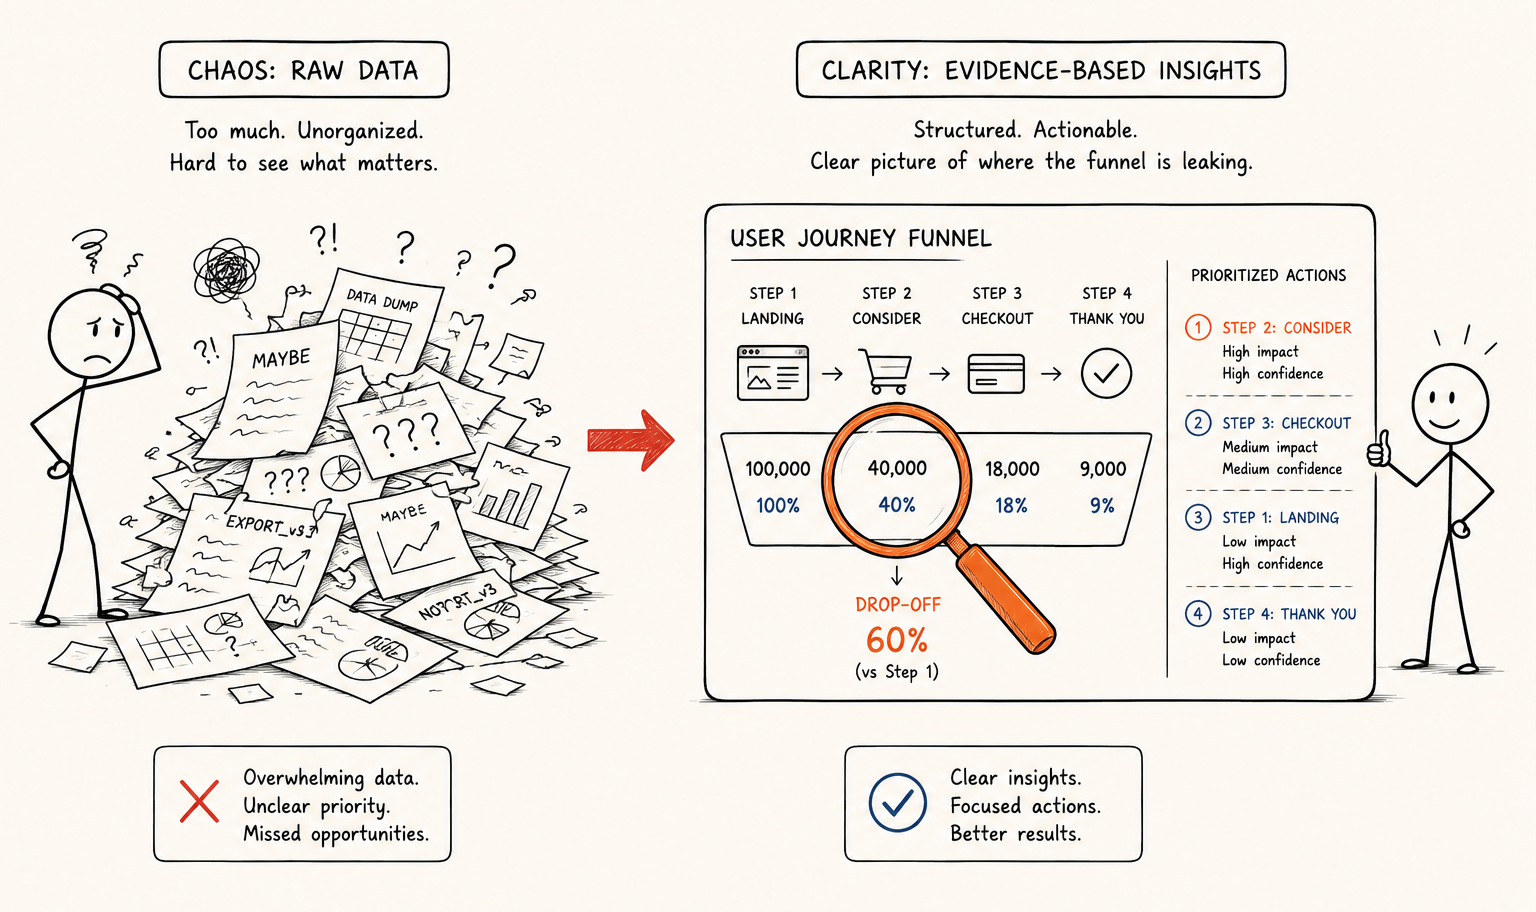
Chart every step a visitor takes from first touch to conversion. For each step, record the entry volume, completion rate, and exit rate. This funnel map shows you where the largest absolute volume of drop off is happening. A drop-off of 10% on a step that sees 50,000 users per month is a different priority than a 40% drop-off on a step that sees 500.
For each high traffic or high exit page in the funnel, review heatmaps and session recordings to understand what visitors are actually doing. Look for patterns: where are users clicking that produces no result, where are they scrolling to, what content are they ignoring, at what point are they leaving?
Conversion problems are frequently messaging problems. The value proposition may be unclear. The CTA may not communicate what happens next. The headline may not match the intent of the visitor arriving from a specific source.
Review every key page for: headline relevance to the source, clarity of the value proposition in the first viewport, specificity of the CTA, and absence of language that creates doubt or confusion.
Technical issues kill conversions silently. Run page speed tests across key pages on both mobile and desktop. Test the checkout or form flow on multiple devices. Check for broken links, redirects, or elements that do not load correctly.
Data tells you where people leave. It rarely tells you why. Qualitative methods fill that gap.
Options include on site surveys triggered at exit intent, post conversion feedback surveys asking what almost stopped the user from completing, and usability testing sessions with representative users.
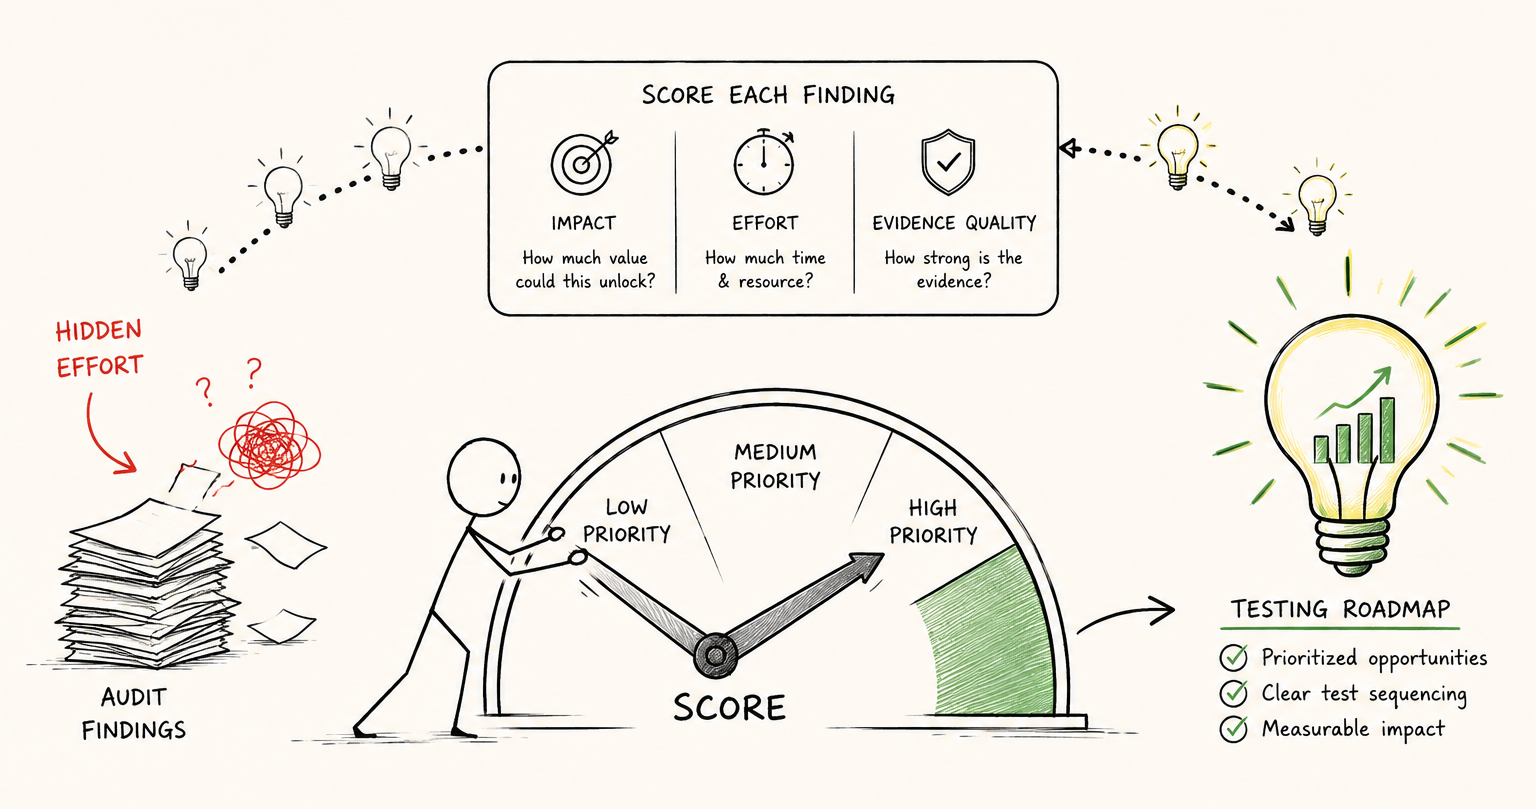
List every issue identified. For each, estimate the likely impact on conversion (high, medium, low), the effort required to fix it (high, medium, low), and the confidence level behind the finding based on data volume or clarity of evidence. This gives you the inputs you need to prioritise without relying on opinion.
No single tool covers everything. A thorough audit draws on several categories of tools working together.
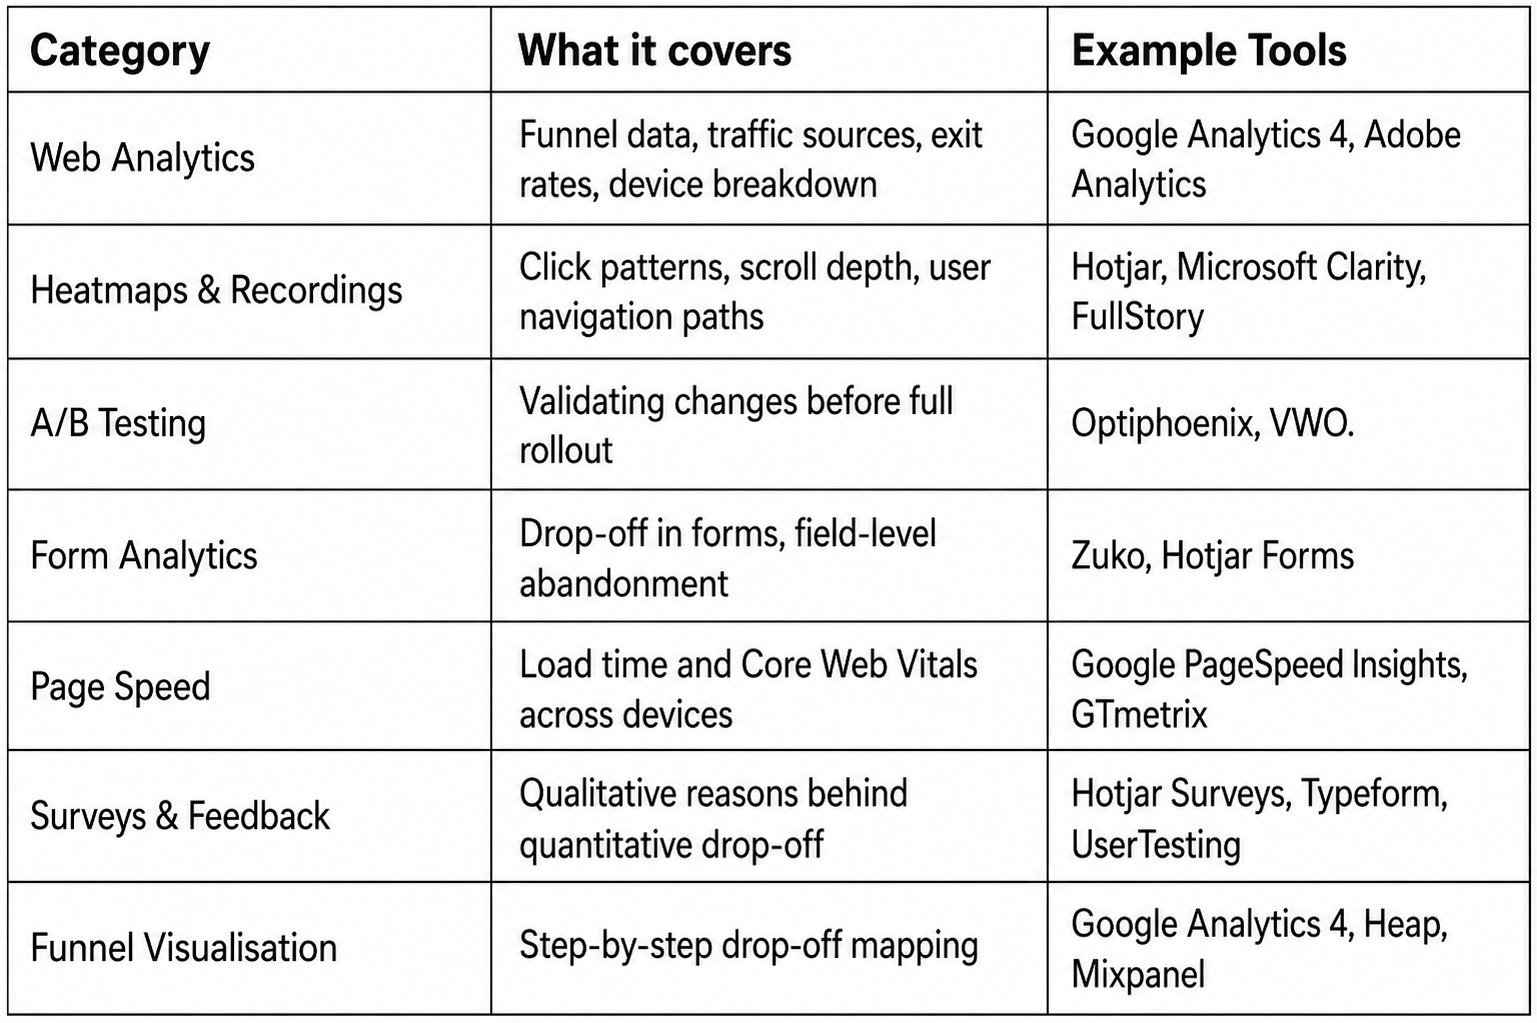
Tool selection depends on your stack, budget, and the complexity of the site. What matters is combining quantitative data with qualitative insight. Using only one type produces incomplete findings.
Teams often conflate a CRO audit with a general website or SEO audit. They serve different purposes.
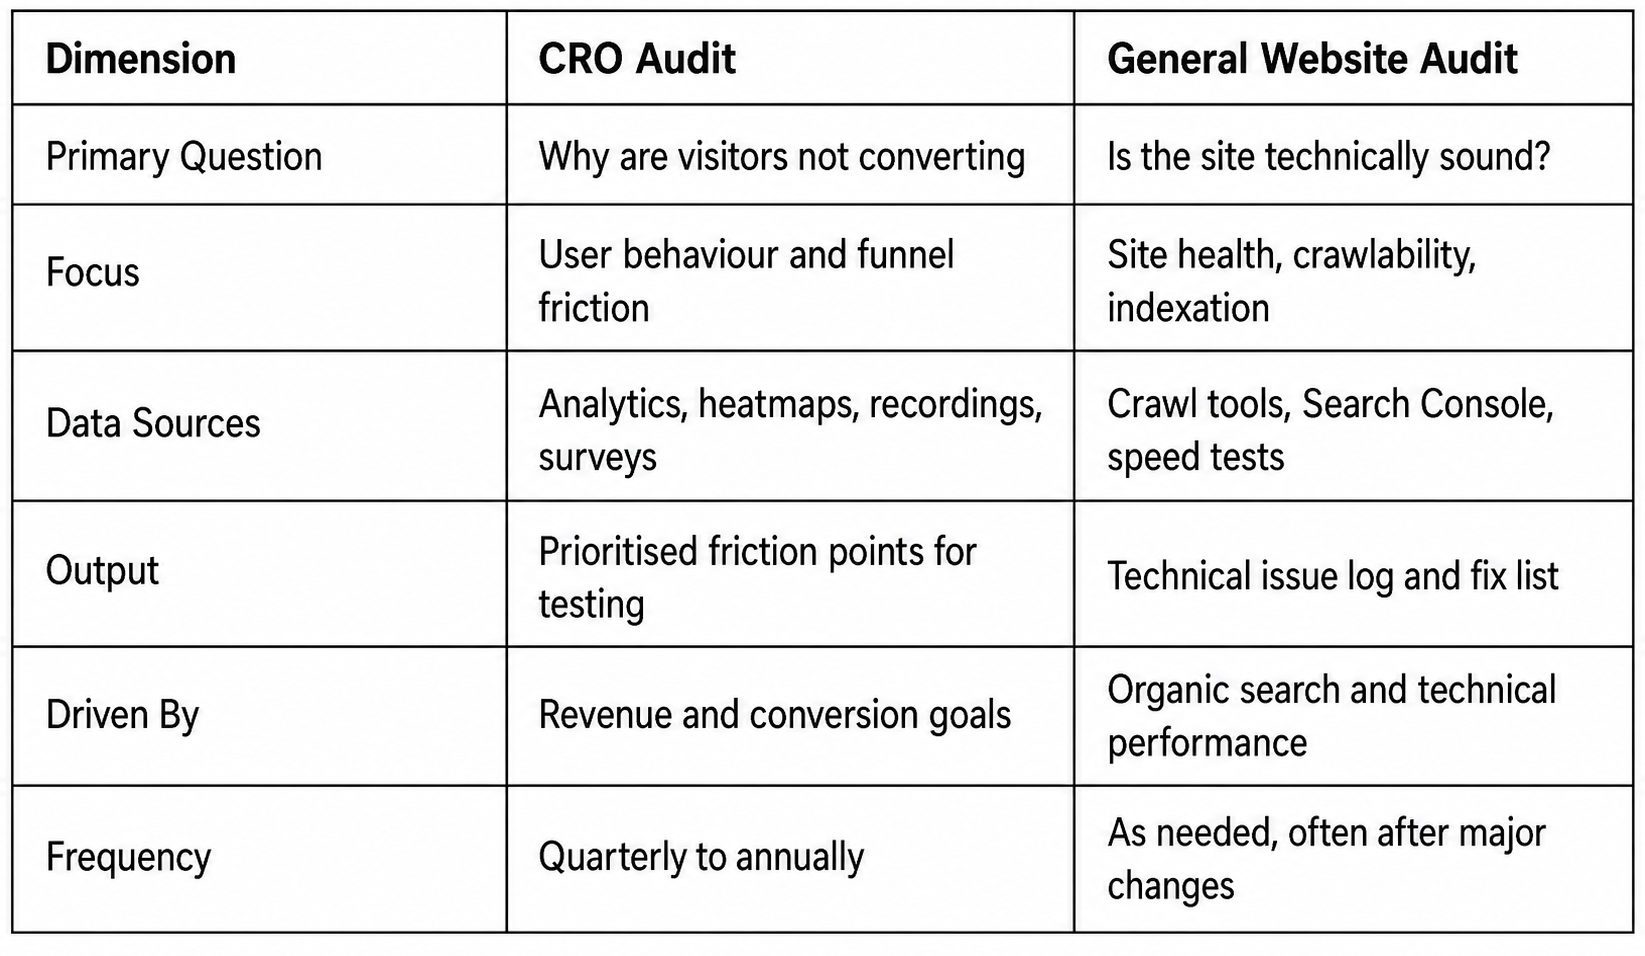
A site can pass every technical audit check and still convert poorly. Conversion is a function of user experience, messaging clarity, trust, and funnel design. None of those are measured by crawl tools.
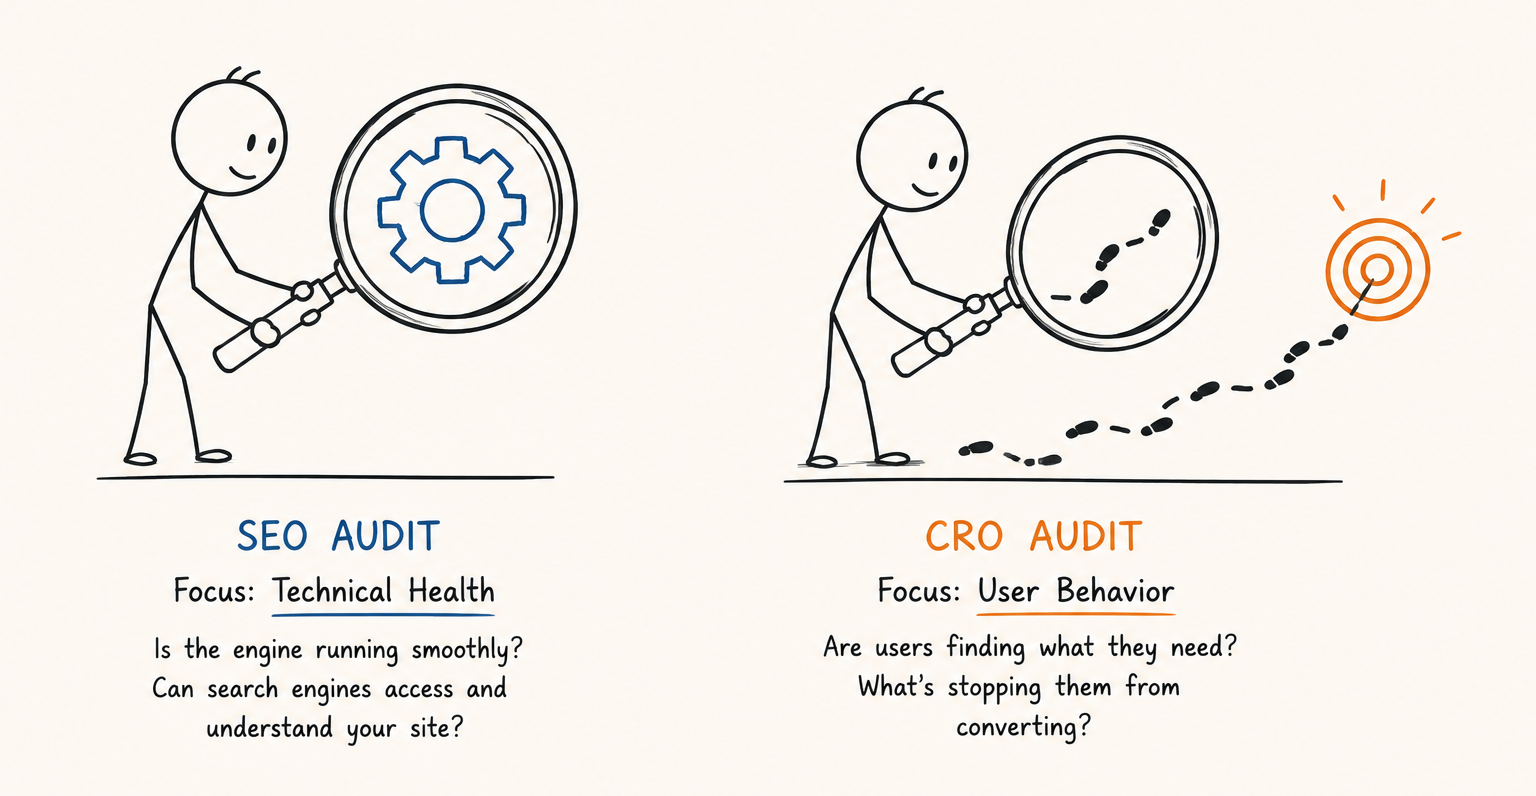
Every site is different, but certain patterns appear consistently across conversion optimization audits.
Long, complex checkout processes cause over 22% of shoppers to abandon their purchase. (Source: Baymard Institute) Reducing form fields to the functional minimum, enabling guest checkout, and simplifying payment options are common high-impact fixes.
Calls to action that do not communicate what happens next, that are buried below the fold, or that compete with multiple equally prominent options on the same page consistently depress conversion. Audit findings frequently surface pages where the CTA exists but is not doing its job.
Many sites are designed on desktop and adapted for mobile as an afterthought. Conversion audits regularly find that mobile bounce rates are significantly higher than desktop, with touch targets too small, form inputs difficult to complete, or checkout flows never tested on actual devices.
Visitors making their first purchase or first inquiry are assessing whether to trust you. Audits frequently find that trust signals are present on the homepage but absent from the checkout, cart, or form pages where the decision is actually made.
When the headline or offer on a landing page does not match what the visitor was promised in the ad or link that brought them, bounce rates rise immediately. This is one of the most consistently underestimated conversion leaks in paid traffic campaigns.
Page load issues on the homepage may be tolerated. The same issues on a product page, checkout page, or lead capture form reduce conversions with every second of delay. Audits flag where speed problems are most consequential, not just where they exist.
A thorough audit will surface more issues than you can address at once. Prioritisation determines whether you see results quickly or stall in a long backlog.
The most straightforward prioritisation framework uses three variables:
One pattern worth naming: teams that skip evidence quality as a variable tend to build roadmaps that feel comprehensive but produce few results. They act on findings from small data samples with high confidence and delay findings from large data samples because the fix seems harder. The result is a lot of changes that do not move the needle.
Evidence quality is not just about data volume. It is about consistency. A finding that appears in your heatmaps, your session recordings, and your exit survey responses simultaneously carries far more weight than one that appears in only one source. Convergence across multiple data types is the signal to act.
An audit produces findings, not results. Results come from acting on those findings systematically.
The audit output should feed directly into a testing roadmap. Each prioritized finding becomes a hypothesis. Each hypothesis becomes an A/B test or a structured experiment. The experiment validates whether the proposed fix actually improves conversion before it is applied at scale. This matters because not every identified friction point has the fix you expect. Removing a field from a form might increase completion rate. Or it might reduce lead quality in a way that costs more downstream. Testing tells you before you commit.
Companies currently spend approximately $1 on conversion rate optimization for every $92 spent on customer acquisition. (Source: Invesp) Think about what that means in practice. Most of what gets spent acquiring visitors, the ads, the content, the SEO, is working to fill a funnel that has not been examined for leaks. The audit is not an add on. It is the work that makes everything else worth doing.
A conversion rate audit is not a project with an end date. It is a point in a continuous cycle: measure, audit, hypothesise, test, implement, measure again, all within our broader CRO framework.
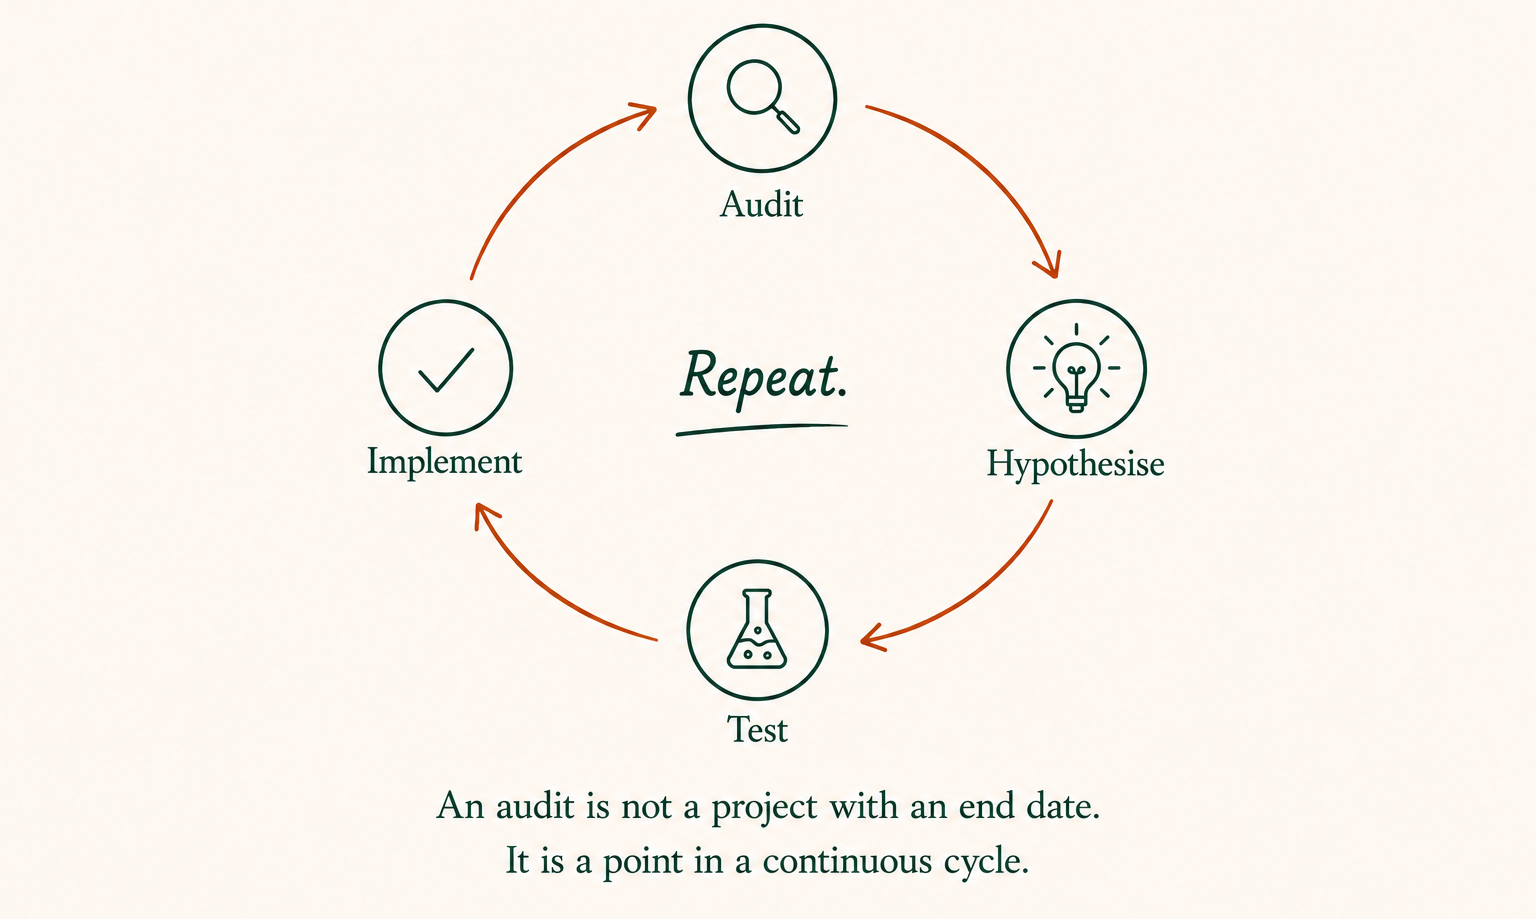
A conversion rate audit is a structured review of your website’s funnel to identify the specific barriers preventing visitors from converting. It combines analytics data, user behaviour analysis, and qualitative research to diagnose friction points across the full customer journey.
A Conversion optimization audit typically takes between 2 and 8 weeks, depending on the size and complexity of the site, the volume of existing data, and the scope of the review. A focused audit on a single funnel or set of pages can be completed faster. A full site audit across multiple devices, channels, and funnel stages takes longer.
The generally recommended cadence is quarterly for high traffic and high transaction sites. For others, a thorough audit once or twice a year, combined with ongoing monitoring of key funnel metrics, is a reasonable baseline.
A CRO audit identifies problems and surfaces hypotheses. A/B testing validates those hypotheses before full implementation. They work together: the audit tells you where to focus, A/B tests confirm what actually works.
A complete audit draws on web analytics (Google Analytics 4 or equivalent), heatmap and session recording tools (Hotjar, Clarity, or FullStory), a page speed testing tool, and some form of qualitative feedback such as on-site surveys or usability testing. The exact stack depends on your site complexity and existing setup.
An SEO audit evaluates how well a site performs in organic search: crawlability, indexation, technical health, and keyword relevance. A website conversion audit evaluates how well a site converts the visitors it already receives. A site can rank well and convert poorly. They measure different problems.
Yes, though data volume affects confidence. A site with very low traffic will have limited heatmap and analytics data to draw from. In those cases, qualitative methods like usability testing carry more weight. Even with limited data, a structured audit will identify structural or copy issues that analytics alone cannot surface.
OptiPhoenix runs structured conversion rate audits grounded in data, not guesswork. We map your funnel, identify your highest impact friction points, and give you a prioritized testing roadmap built around your actual user behaviour.
[Request a CRO Audit at optiphoenix.com]
____________________________________________________________________________